Full Report
The numbers behind DocuSign, Inc.: as-reported financial statements and company metrics for FY2022–FY2026, traced to the source filings, opened with the share-price history those statements have to justify. Every linked figure opens the exact page of the filing it was printed on, with the statement row highlighted. Amounts in US$ thousands unless noted.
Reading notes: Figures are presented in thousands of U.S. dollars, exactly as printed in DocuSign's Form 10-K statements ('(in thousands, except per share data)'). Per-share figures are in dollars. DocuSign's fiscal year ends January 31; 'FY2026' denotes the year ended January 31, 2026. Main columns FY2022–FY2026 are each cited to that year's own Form 10-K (current-year column). Long-Term Record: FY2020 and FY2021 are cited from the comparative columns of the FY2022 Form 10-K; FY2017–FY2019 are from the standardized data feed (SEC XBRL) and are shown without page links (those filings are not in the corpus).
Share Price — Full Available History — 8 Years
The stock closed at $47.04 on Jul 23, 2026 — up 18% over the window shown (+2.1% a year), trading between $37.41 and $310.05. At that close the stock trades at 32× FY2026 diluted EPS as reported below.
Source: market price feed, weekly closes, sampled from 2,071 source observations, Apr 2018–Jul 2026. Price return only, excludes dividends.
Market capitalization $8.3bn.
Market cap = 176.7M shares outstanding × the Jul 23, 2026 close of $47.04. Market-derived, shown without filing links.
FY2026 at a Glance
Revenue (US$ thousands)
Net income (US$ thousands)
Diluted EPS
Source: FY2026 consolidated statements [1] [2] [3] [4]. Click any linked figure to open the filing page with the row highlighted.
Revenue by Type
| Revenue by Type | FY2022 | FY2023 | FY2024 | FY2025 | FY2026 |
|---|---|---|---|---|---|
| Subscription | 2,037,272 | 2,442,177 | 2,686,708 | 2,901,309 | 3,150,551 |
| Professional services and other | 69,941 | 73,738 | 75,174 | 75,430 | 68,949 |
| Total revenue | 2,107,213 | 2,515,915 | 2,761,882 | 2,976,739 | 3,219,500 |
| Total revenue growth, derived | — | +19.4% | +9.8% | +7.8% | +8.2% |
Source: Consolidated Statements of Operations — Revenue disaggregation [1] [2] [3] [4]. Click any linked figure to open the filing page with the row highlighted.
Income Statement
Source: Consolidated Statements of Operations and Comprehensive Income (Loss) [1] [2] [3] [4]. Click any linked figure to open the filing page with the row highlighted.
Columns marked E are consensus analyst estimates from S&P Capital IQ (CapIQ), shown alongside reported results for direct comparison; they are not company guidance.
Estimate source: S&P Capital IQ (CapIQ) consensus, as of 2026-07-24. Estimate figures are S&P Capital IQ consensus (vendor data — no filing page links). EPS and net income use the normalized (adjusted) consensus where the street reports it. Line-item analyst models (segments, drivers, KPIs) are in the Visible Alpha tab.
Balance Sheet
Source: Consolidated Balance Sheets [5] [6] [7] [8]. Click any linked figure to open the filing page with the row highlighted.
Cash Flow
Source: Consolidated Statements of Cash Flows [9] [10] [11] [12]. Click any linked figure to open the filing page with the row highlighted.
Revenue by Geography
| Revenue by Geography | FY2022 | FY2023 | FY2024 | FY2025 | FY2026 |
|---|---|---|---|---|---|
| U.S. | 1,625,966 | 1,895,932 | 2,032,950 | 2,142,777 | 2,274,470 |
| International | 481,247 | 619,983 | 728,932 | 833,962 | 945,030 |
| Total revenue | 2,107,213 | 2,515,915 | 2,761,882 | 2,976,739 | 3,219,500 |
Source: Note 16. Segment and Geographic Information [13] [14] [15] [16]. Click any linked figure to open the filing page with the row highlighted.
Customer Base and Recurring Revenue
| Customer Base and Recurring Revenue | FY2022 | FY2023 | FY2024 | FY2025 | FY2026 |
|---|---|---|---|---|---|
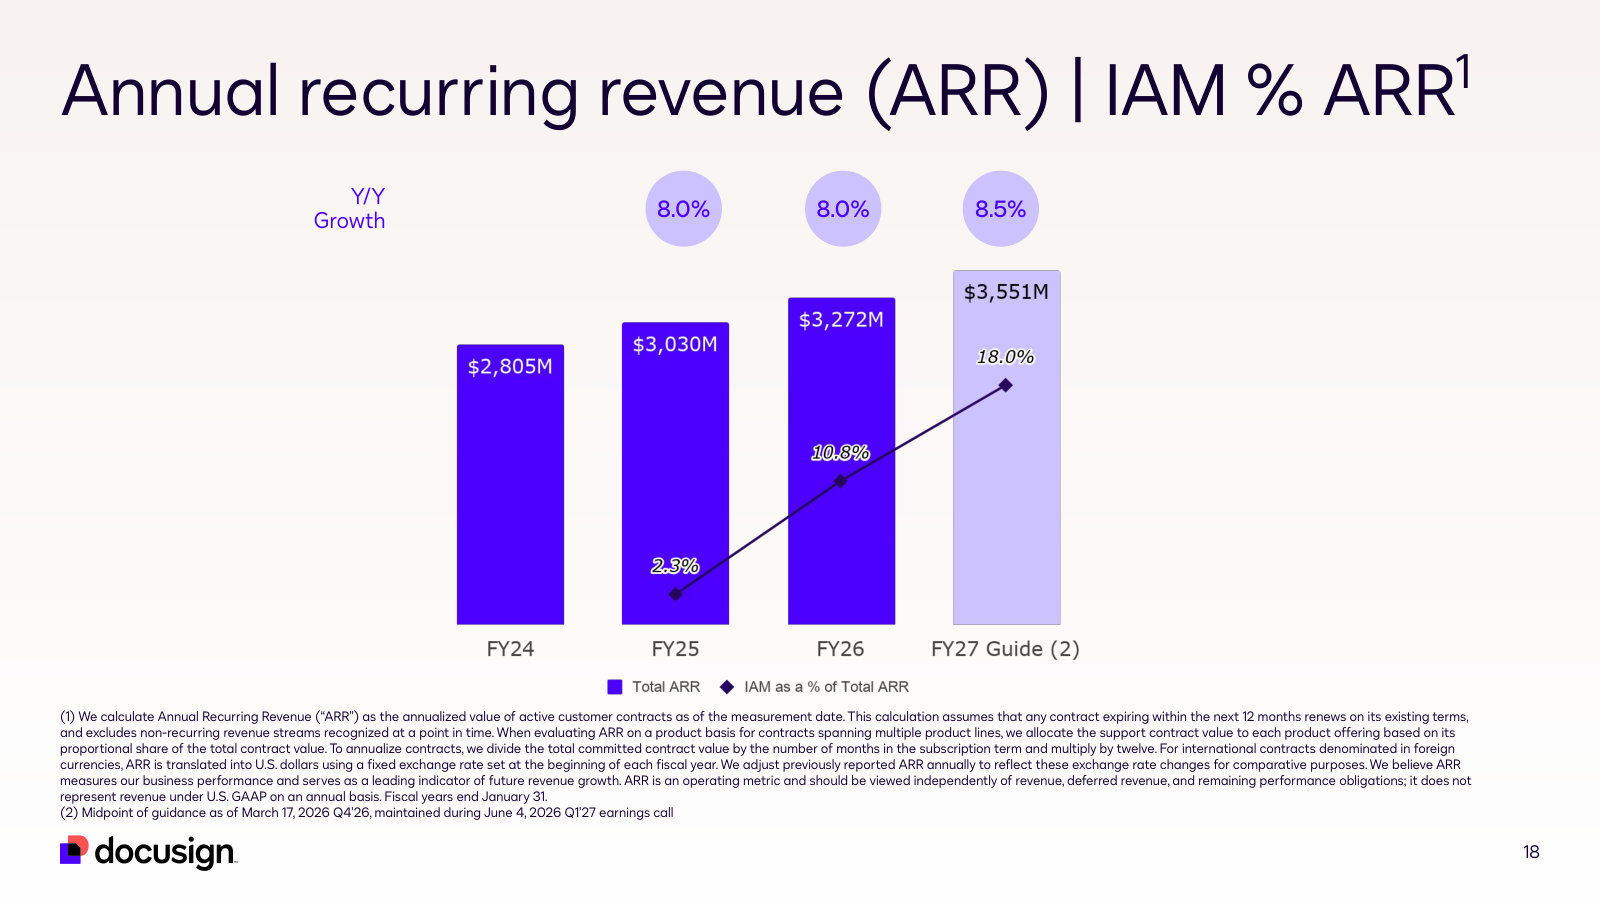
| Annual recurring revenue (ARR) | — | — | 2,805,000 | 3,030,000 | 3,272,000 |
| Dollar net retention rate (fiscal Q4 exit) | — | — | 98.0% | 101.0% | 102.0% |
| Direct enterprise and commercial customers | 170,000 | 211,000 | 242,000 | 260,000 | 280,000 |
| IAM share of total ARR | — | — | — | 2.3% | 10.8% |
| Revenue from customers outside the U.S. (% of total) | 23.0% | 25.0% | 26.0% | 28.0% | 29.0% |
Source: company filings [17] [18] [19] [20]. Click any linked figure to open the filing page with the row highlighted.
Contracted Backlog and Deferred Revenue
| Contracted Backlog and Deferred Revenue | FY2022 | FY2023 | FY2024 | FY2025 | FY2026 |
|---|---|---|---|---|---|
| Remaining performance obligations (contracts greater than one year) | 1,600,000 | 1,900,000 | 2,200,000 | 2,400,000 | 2,400,000 |
| Share of remaining performance obligations to be recognized within 12 months | 53.0% | 57.0% | 56.0% | 55.0% | 57.0% |
| Contract liabilities and refund liability, end of period | 1,049,106 | 1,191,269 | 1,343,792 | 1,479,266 | 1,663,128 |
| Contract assets | 12,600 | 12,400 | 15,900 | 13,800 | 10,800 |
Source: company filings [21] [22] [23] [24]. Click any linked figure to open the filing page with the row highlighted.
Non-GAAP Operating Model
| Non-GAAP Operating Model | FY2022 | FY2023 | FY2024 | FY2025 | FY2026 |
|---|---|---|---|---|---|
| Non-GAAP subscription gross margin | 85.0% | 84.9% | 85.2% | 84.2% | 83.6% |
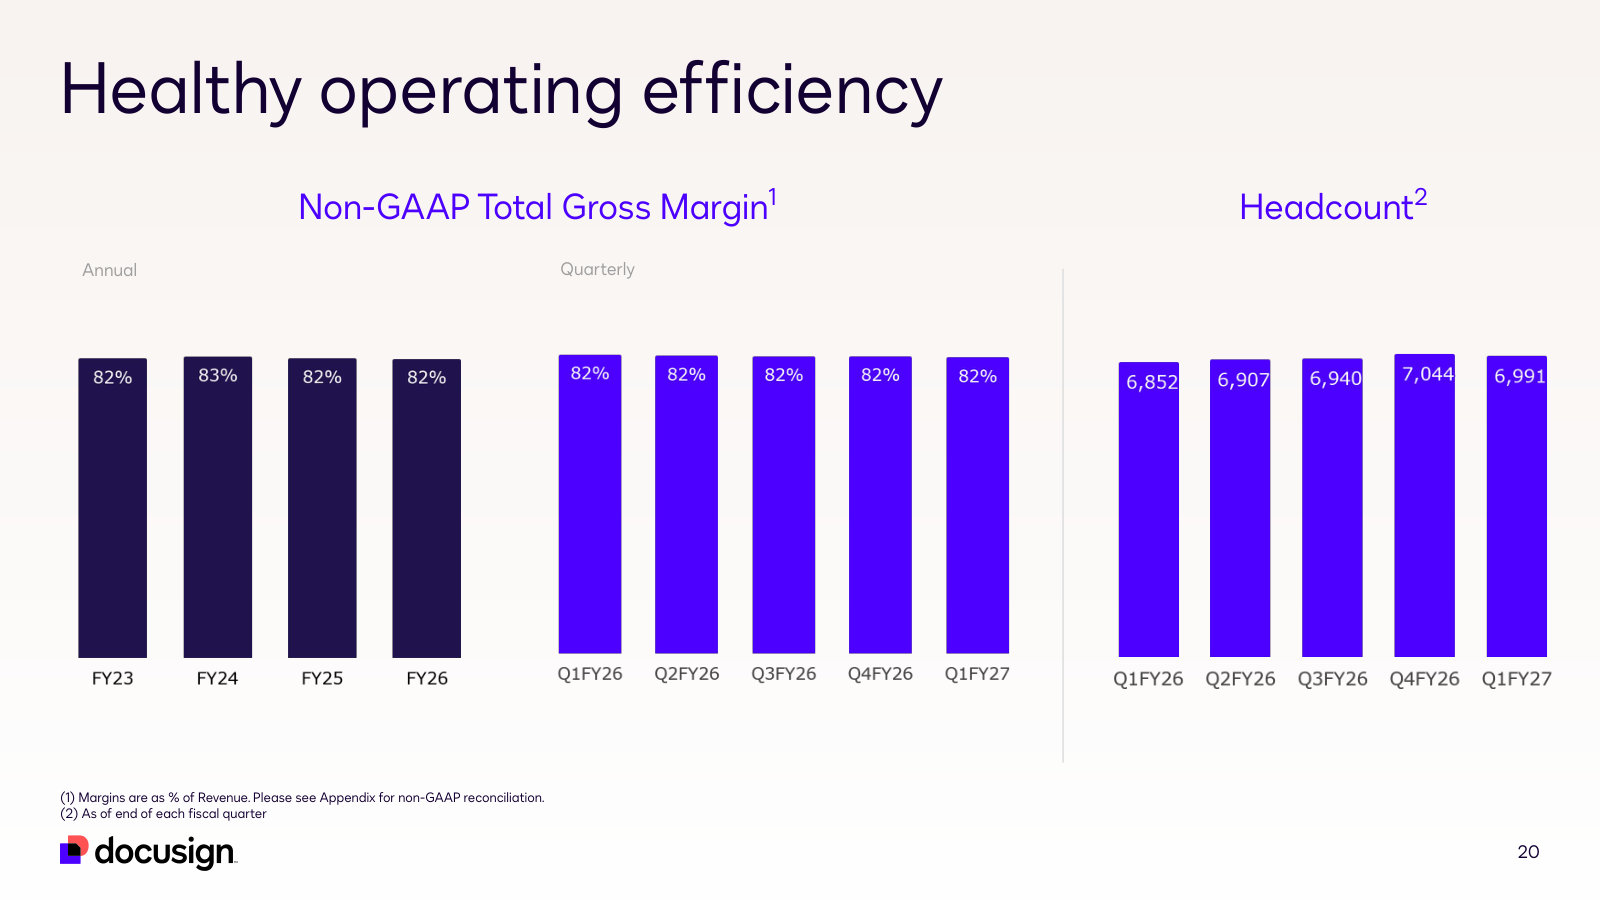
| Non-GAAP gross margin | 82.0% | 82.1% | 82.6% | 82.2% | 82.0% |
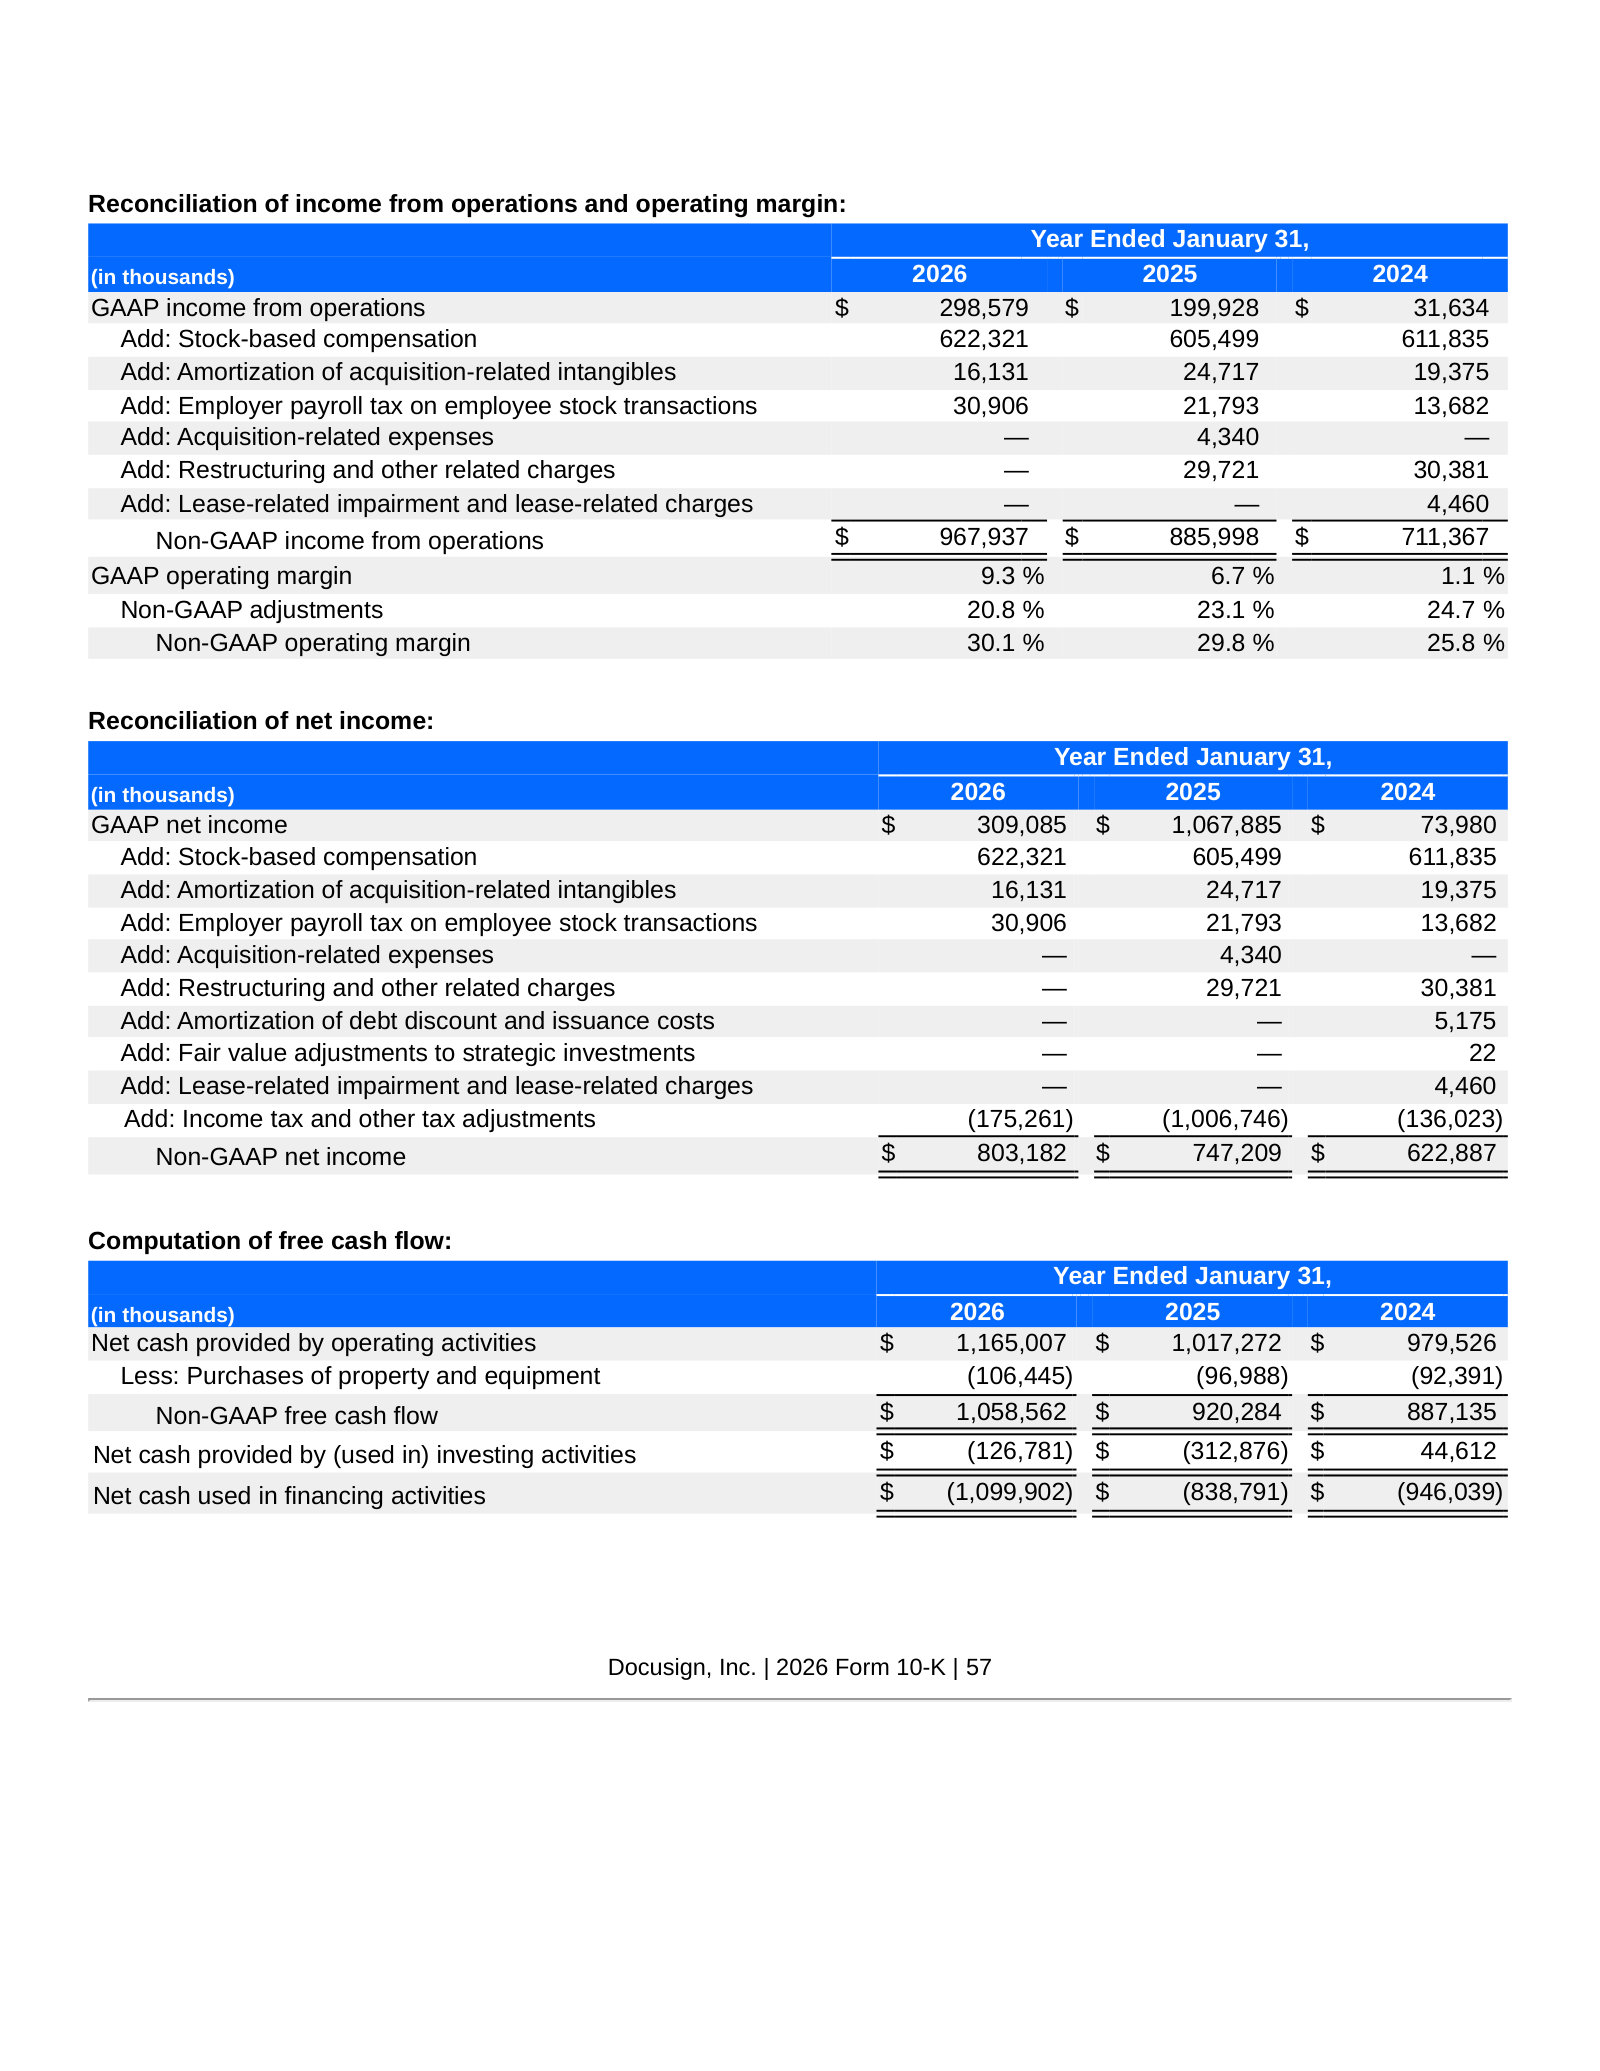
| Non-GAAP income from operations | 419,106 | 516,846 | 711,367 | 885,998 | 967,937 |
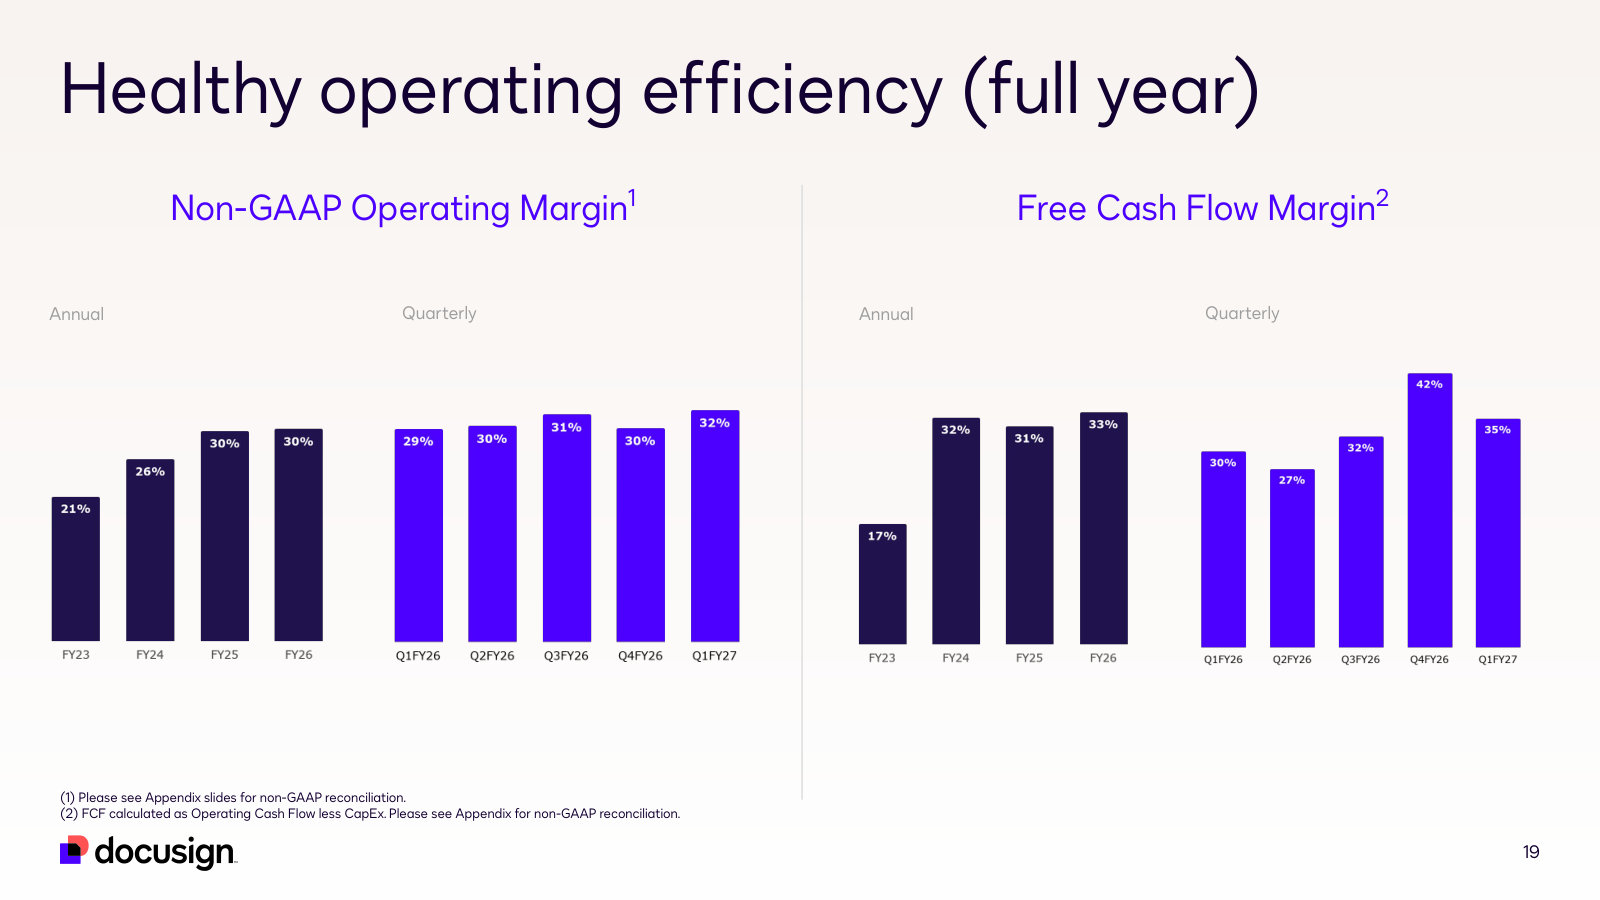
| Non-GAAP operating margin | 20.0% | 20.5% | 25.8% | 29.8% | 30.1% |
| Non-GAAP net income | 410,842 | 418,924 | 622,887 | 747,209 | 803,182 |
| Non-GAAP free cash flow | 445,071 | 429,105 | 887,135 | 920,284 | 1,058,562 |
Source: company filings [25] [20] [26] [27]. Click any linked figure to open the filing page with the row highlighted.
Stock Compensation, Buybacks and Workforce
| Stock Compensation, Buybacks and Workforce | FY2022 | FY2023 | FY2024 | FY2025 | FY2026 |
|---|---|---|---|---|---|
| Stock-based compensation expense | 408,542 | 533,100 | 611,835 | 605,499 | 622,321 |
| Shares repurchased (thousands of shares) | — | 1,135 | 3,058 | 10,954 | 11,840 |
| Employees | 7,461 | 7,336 | 6,840 | 6,838 | 7,044 |
| Employees based in the U.S. (% of total) | 69.0% | 67.0% | 67.0% | 63.0% | 60.0% |
Source: company filings [28] [25] [29] [30]. Click any linked figure to open the filing page with the row highlighted.
Long-Term Record
| Fiscal year | Total revenue | Income (loss) from operations | Net income (loss) | Diluted net income (loss) per share | Net cash provided by operating activities | Purchases of property and equipment |
|---|---|---|---|---|---|---|
| FY2017 | 381,459 | (115,817) | (115,412) | — | (4,790) | (43,330) |
| FY2018 | 518,504 | (51,653) | (52,276) | — | 54,979 | (18,929) |
| FY2019 | 700,969 | (426,323) | (426,458) | — | 76,086 | (30,413) |
| FY2020 | 973,971 | (193,509) | (208,359) | (1.18) | 115,696 | (72,046) |
| FY2021 | 1,453,047 | (173,855) | (243,267) | (1.31) | 296,954 | (82,395) |
| FY2022 | 2,107,213 | (61,884) | (69,976) | (0.36) | 506,467 | (61,396) |
| FY2023 | 2,515,915 | (88,031) | (97,454) | (0.49) | 506,759 | (77,654) |
| FY2024 | 2,761,882 | 31,634 | 73,980 | 0.36 | 979,526 | (92,391) |
| FY2025 | 2,976,739 | 199,928 | 1,067,885 | 5.08 | 1,017,272 | (96,988) |
| FY2026 | 3,219,500 | 298,579 | 309,085 | 1.48 | 1,165,007 | (106,445) |
Source: consolidated statements across filings; older years from the standardized feed [9] [1] [10] [2]. Click any linked figure to open the filing page with the row highlighted.
Operating KPIs
| KPI | FY2022 | FY2023 | FY2024 | FY2025 | FY2026 |
|---|---|---|---|---|---|
| Total customers | 1,100,000 | 1,300,000 | 1,500,000 | 1,700,000 | 1,800,000 |
| Customers with greater than $300,000 in annualized contract value | 852 | 1,080 | 1,060 | 1,131 | 1,205 |
| Billings (non-GAAP) | 2,358,127 | 2,659,736 | 2,910,831 | 3,109,559 | 3,406,282 |
Source: company-reported operating metrics [22] [31] [32] [24]. Click any linked figure to open the filing page with the row highlighted.
Analyst Consensus
Mean target
Median target
High target
Low target
Street ratings: 2 strong buy, 3 buy, 16 hold, 1 sell. Consensus: Hold.
Estimate source: S&P Capital IQ (CapIQ) consensus, as of 2026-07-24. Estimate figures are S&P Capital IQ consensus (vendor data — no filing page links). EPS and net income use the normalized (adjusted) consensus where the street reports it. Line-item analyst models (segments, drivers, KPIs) are in the Visible Alpha tab.
Traceability
422 of 437 figures on this page (97%) link to the filing page where they are printed — click a linked figure to open the source PDF at that page with the row highlighted. Unlinked figures come from standardized data feeds or pre-filing years.
Figures are presented in thousands of U.S. dollars, exactly as printed in DocuSign's Form 10-K statements ('(in thousands, except per share data)'). Per-share figures are in dollars.
DocuSign's fiscal year ends January 31; 'FY2026' denotes the year ended January 31, 2026.
Main columns FY2022–FY2026 are each cited to that year's own Form 10-K (current-year column).
Long-Term Record: FY2020 and FY2021 are cited from the comparative columns of the FY2022 Form 10-K; FY2017–FY2019 are from the standardized data feed (SEC XBRL) and are shown without page links (those filings are not in the corpus).
DocuSign operates as a single reportable segment; the revenue breakdown uses the company's own disaggregation (subscription vs. professional services other) plus its reported U.S./International geographic split. No segment-profit statement is applicable.
Convertible senior notes were fully repaid during FY2024; the company has carried no funded debt since, so no debt line is shown in the summary balance sheet.
Effective Q1 FY2027, DocuSign combined the 'Subscription' and 'Professional services and other' revenue lines into a single 'Revenue' line on the face of its income statement; the Q1 FY27 quarterly revenue row cites that combined line.
Quarterly cash-flow figures are the single-quarter (three-months-ended) columns printed directly in each earnings-release 8-K, not derived from year-to-date statements.
Total customers are the company's own approximate disclosures ('over 1.1 million', 'nearly 1.7 million', etc.); the count column shows the rounded figure and the linked figure highlights the disclosure sentence.
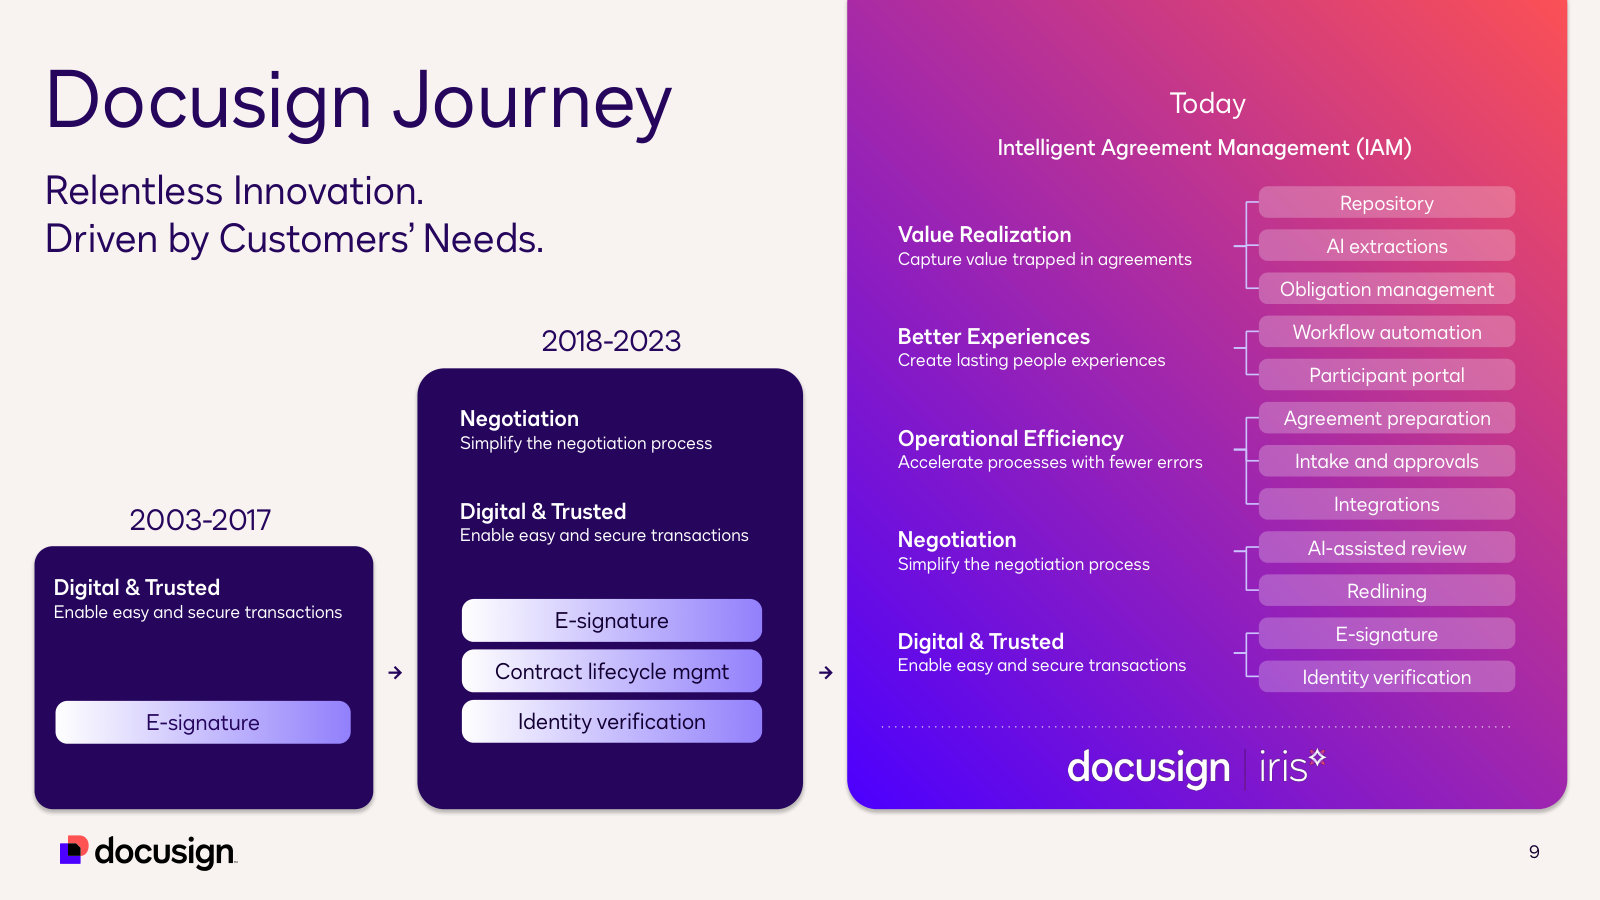
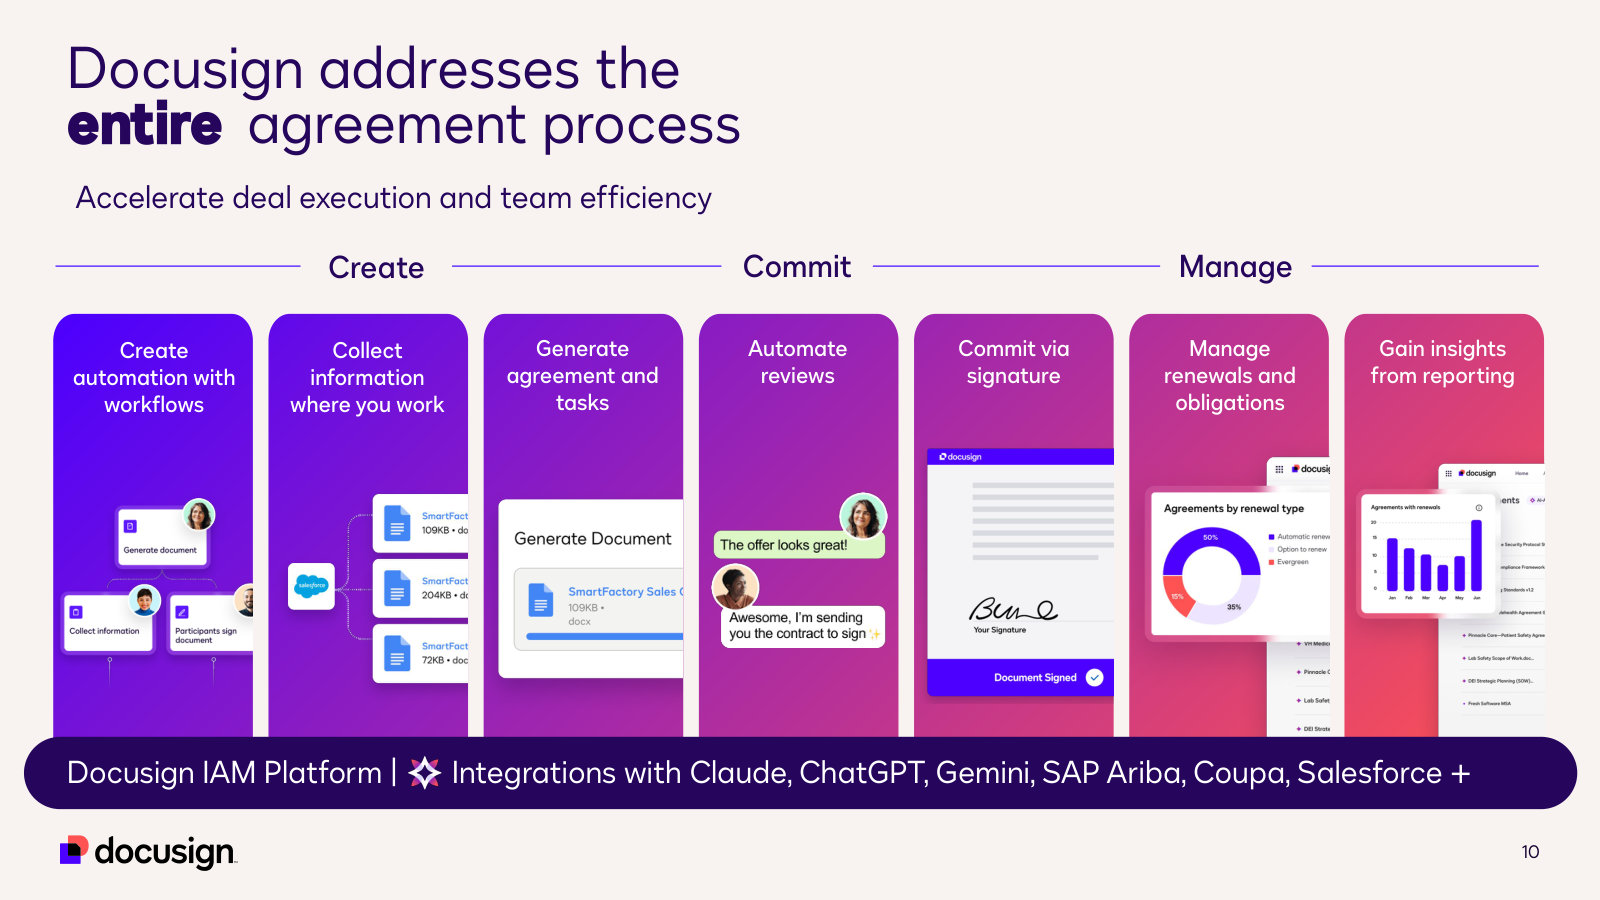
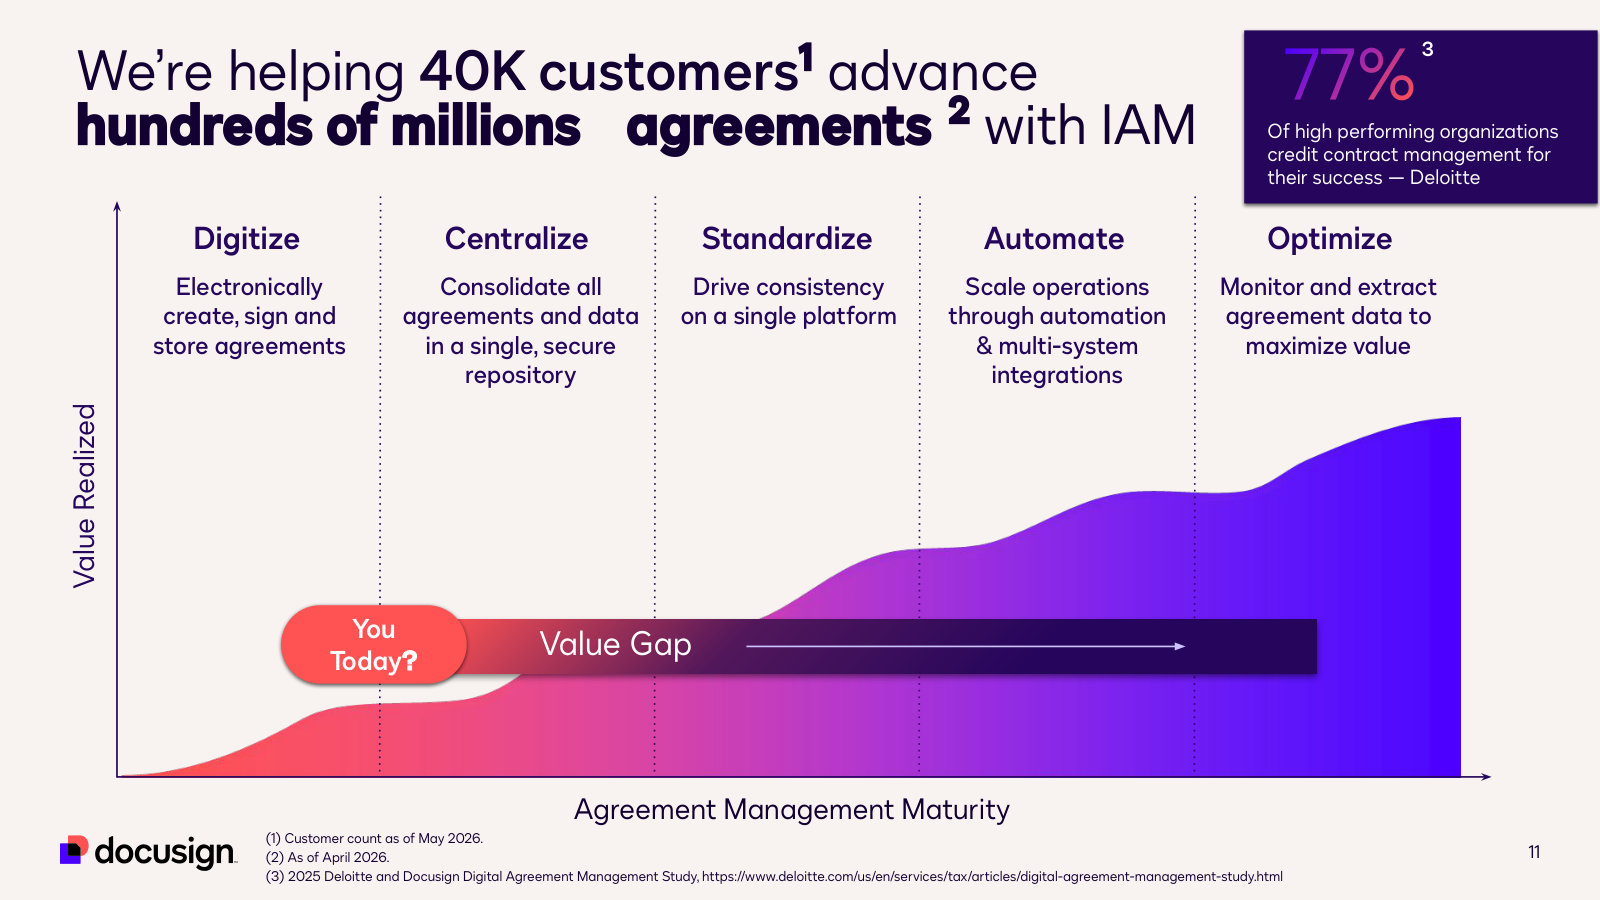
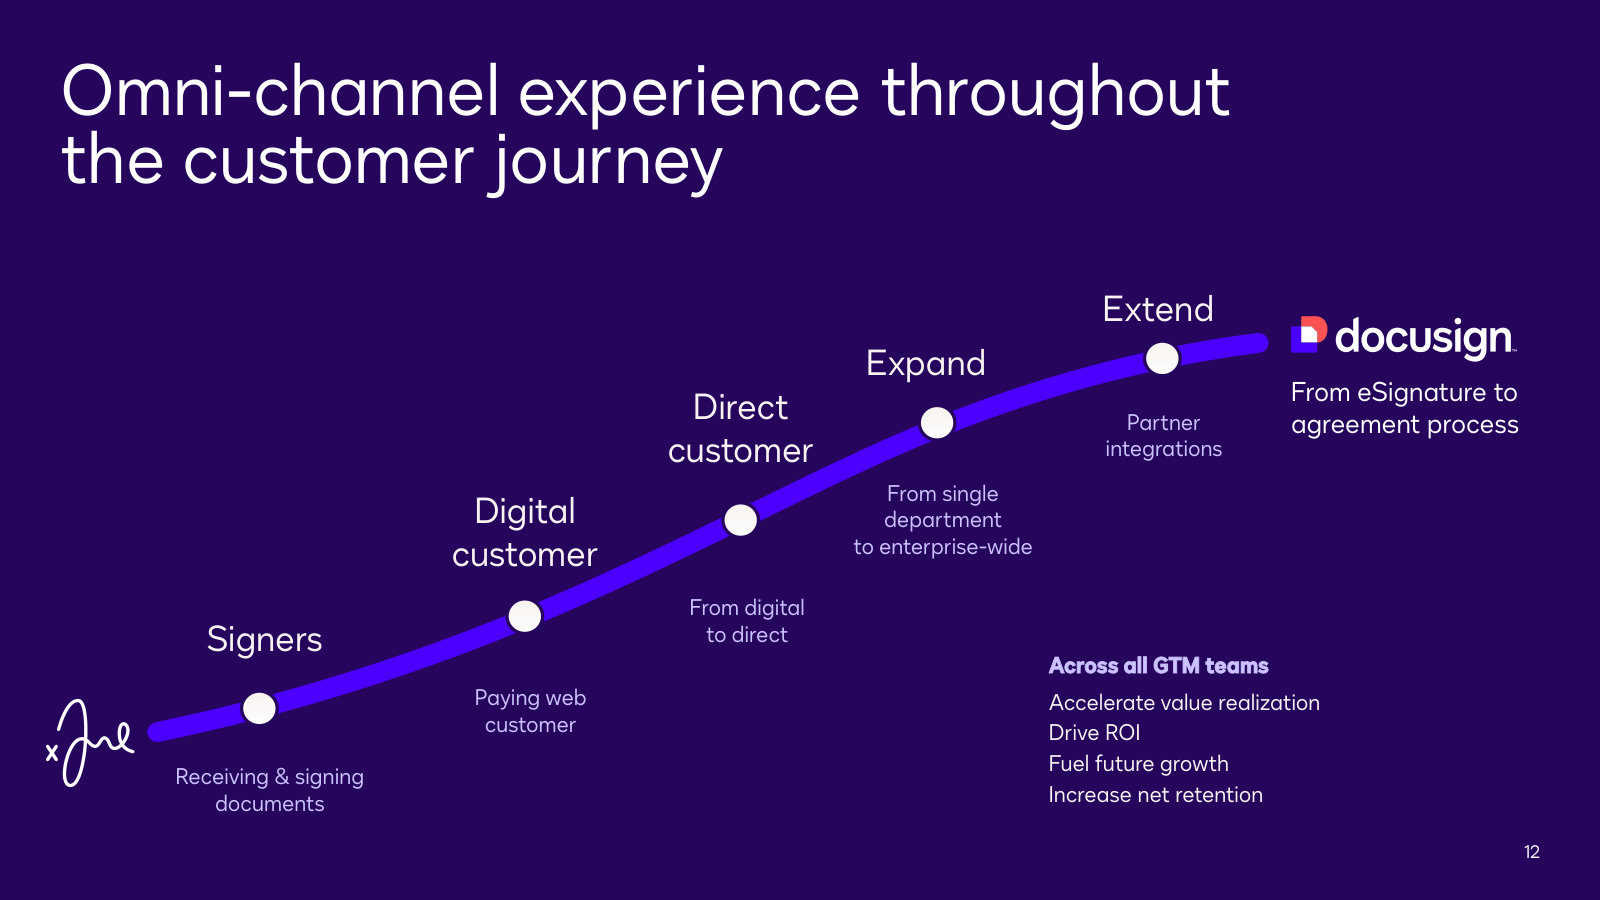
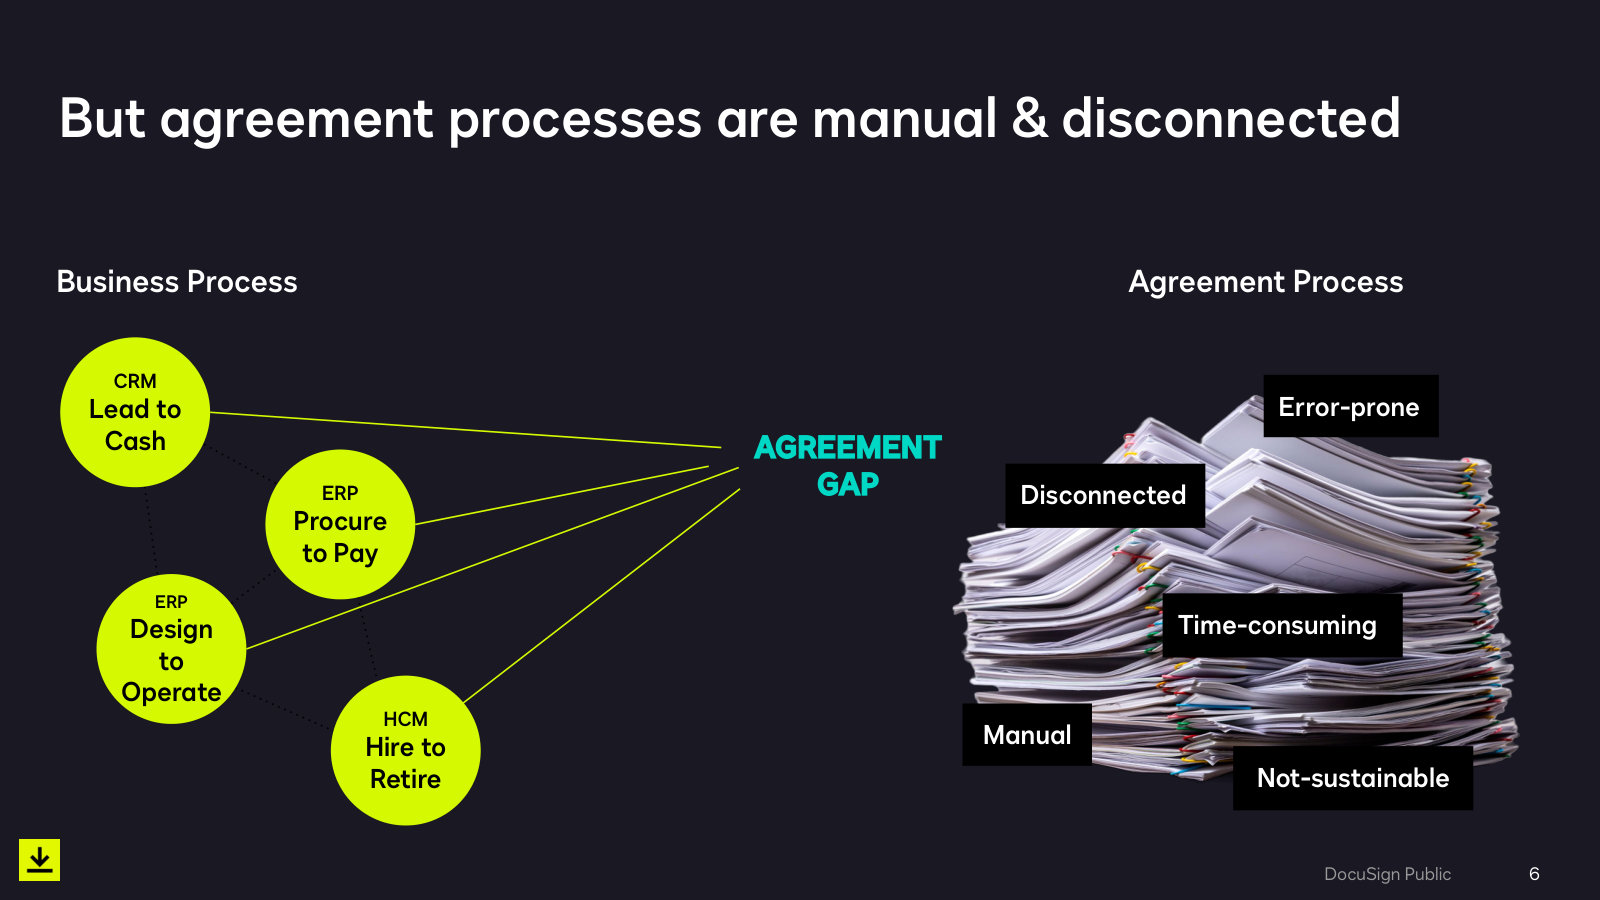
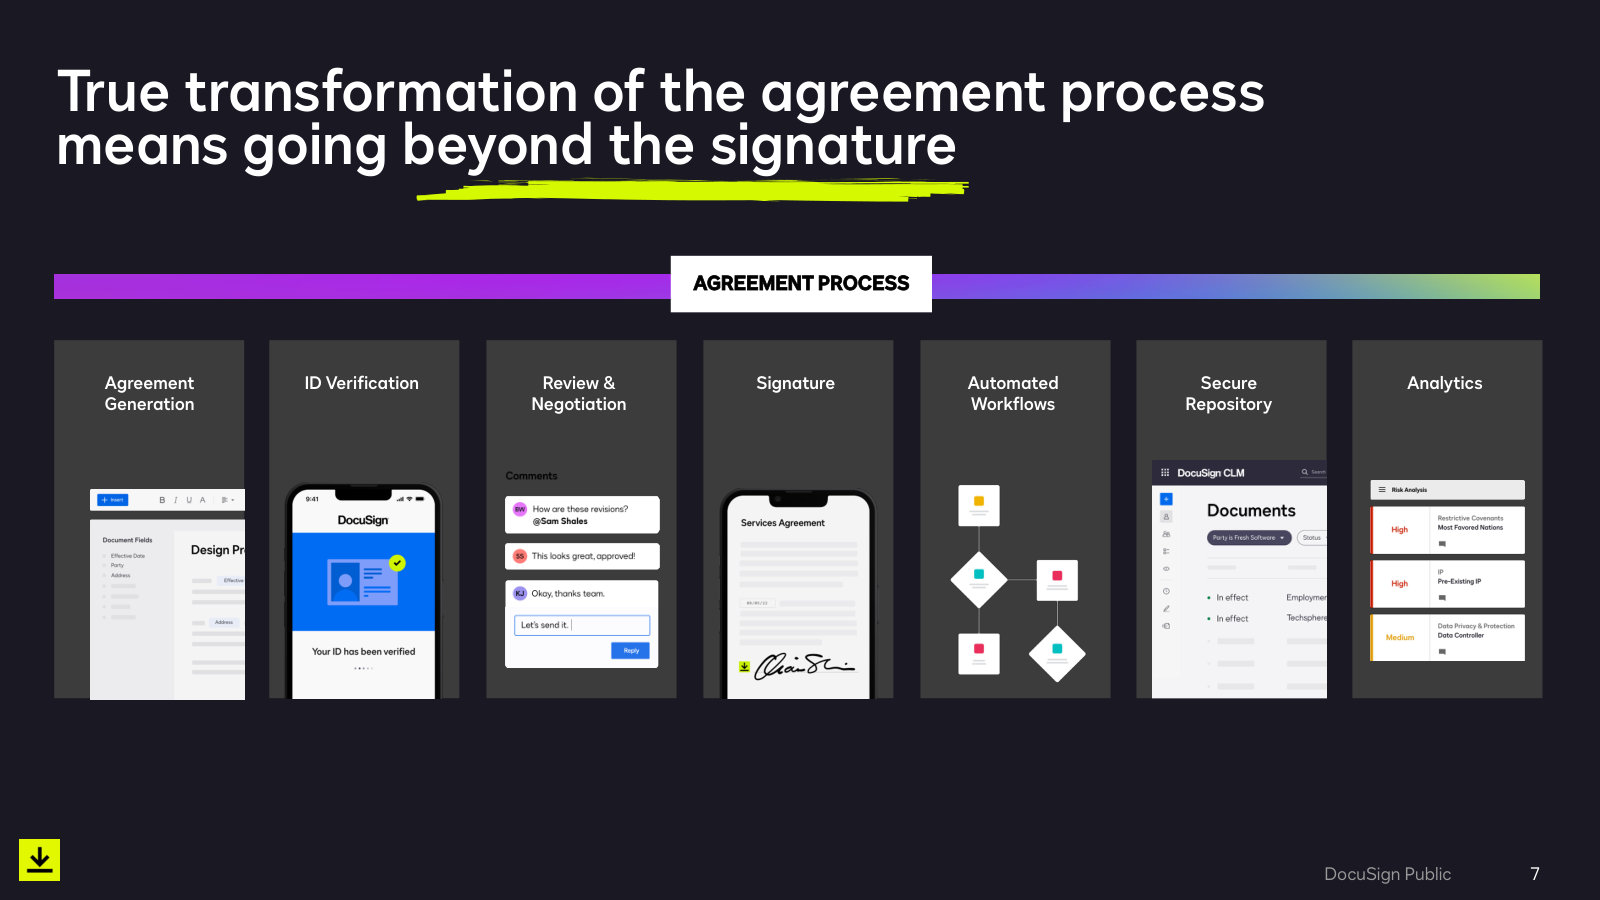
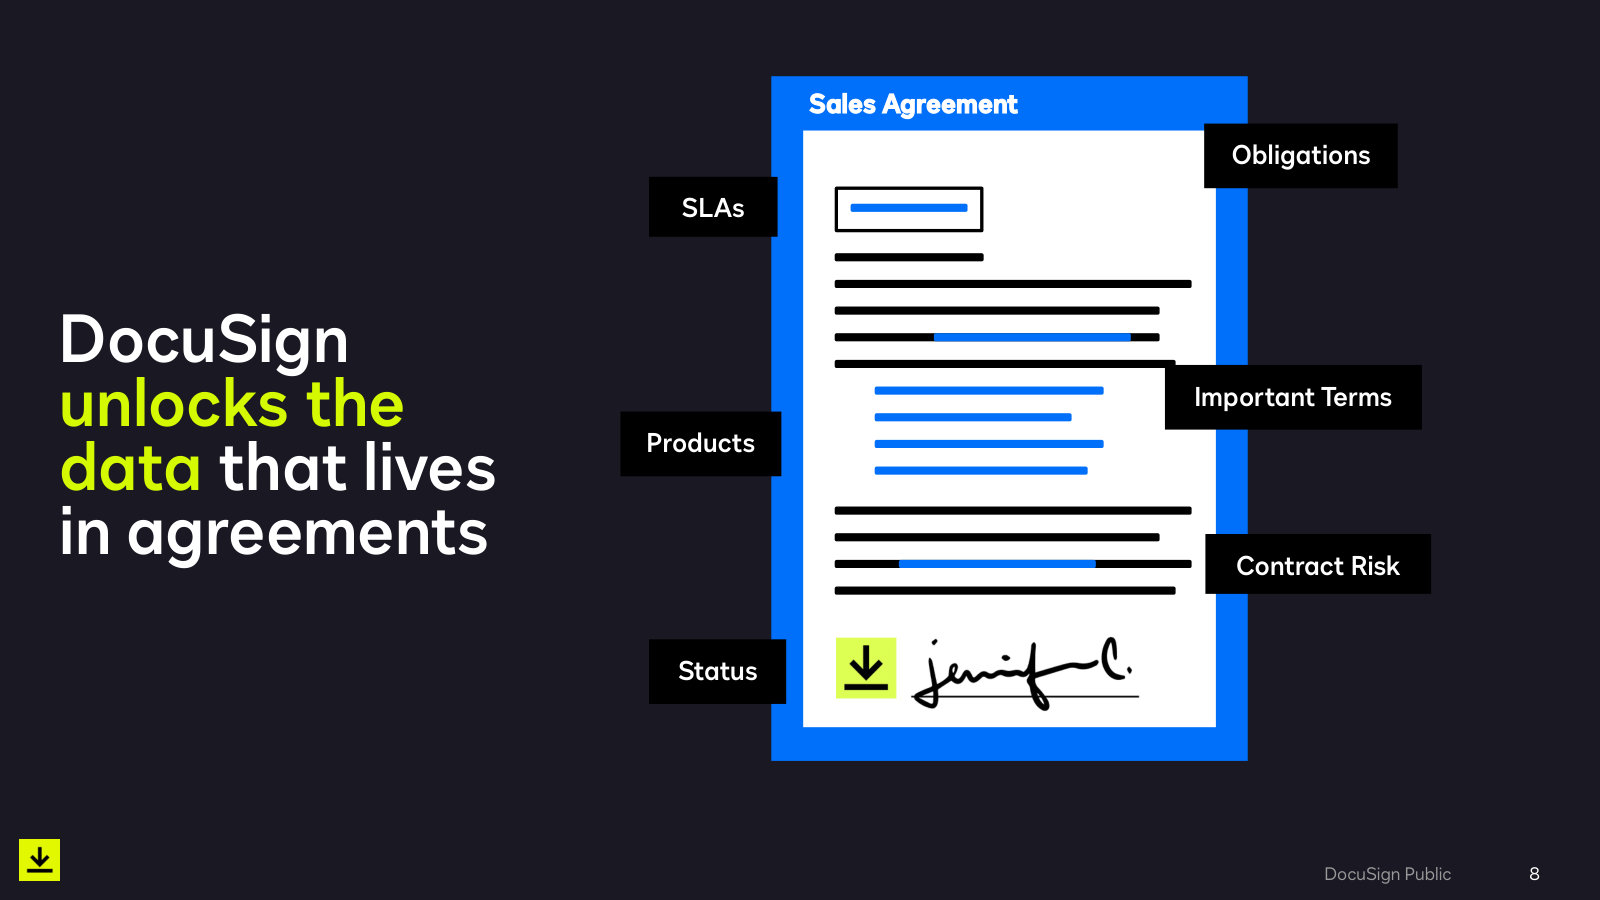
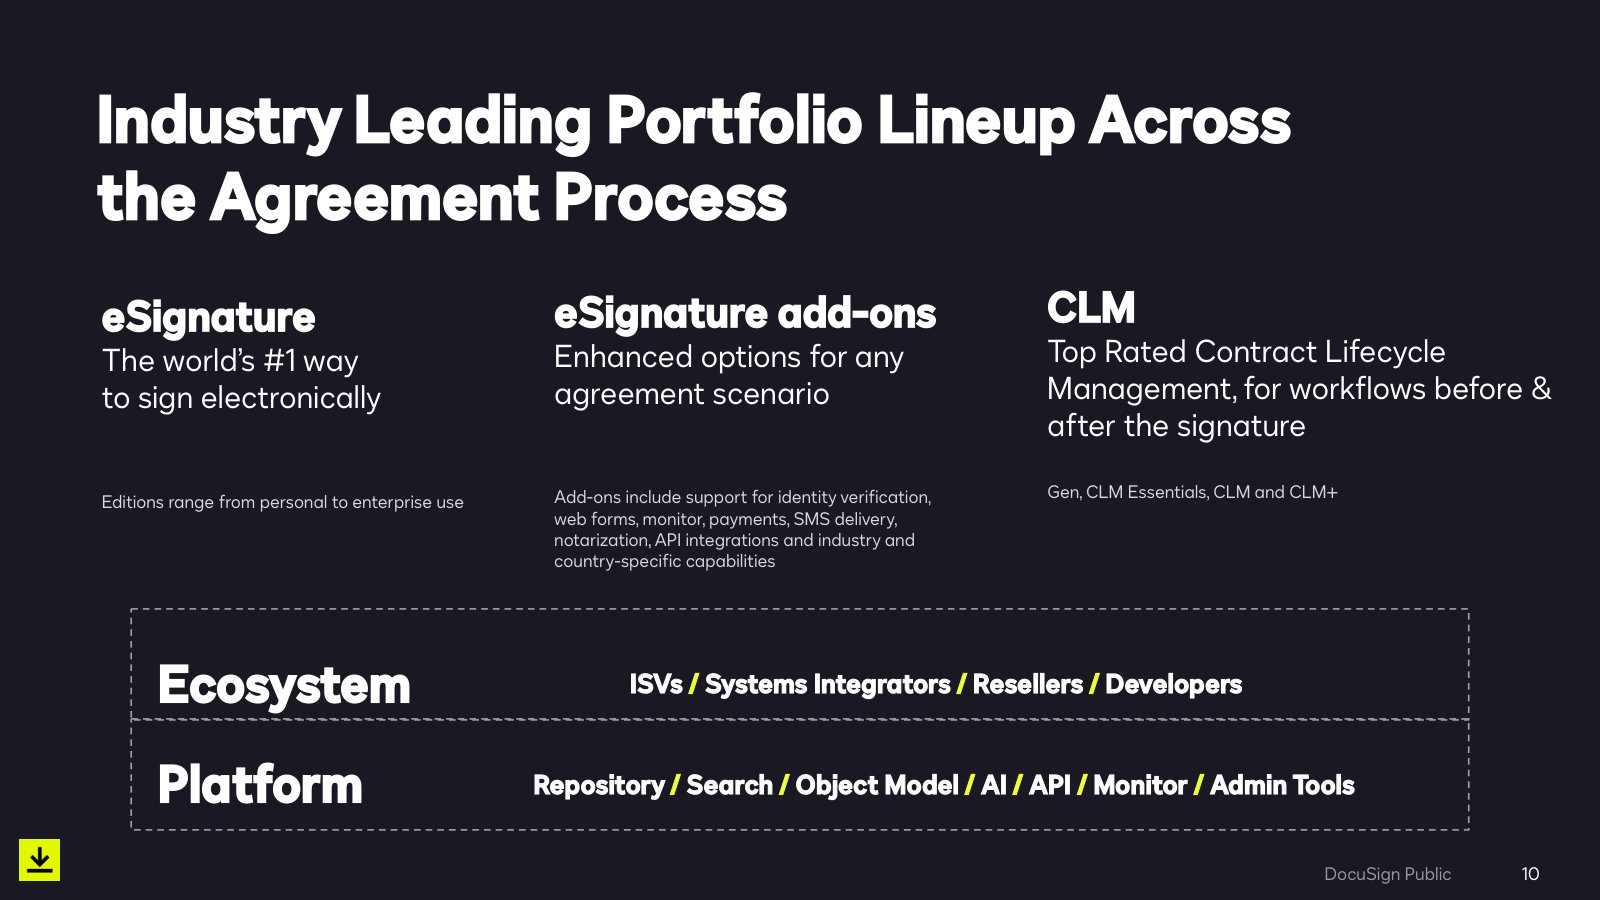
DocuSign, Inc.'s management explains the business in its own materials. The slides below do the most of that work, pulled from the documents preserved in Sources. Each source link opens the complete presentation at that slide in a new tab.
Investor Presentation — Q1 FY27 — Q1 FY27
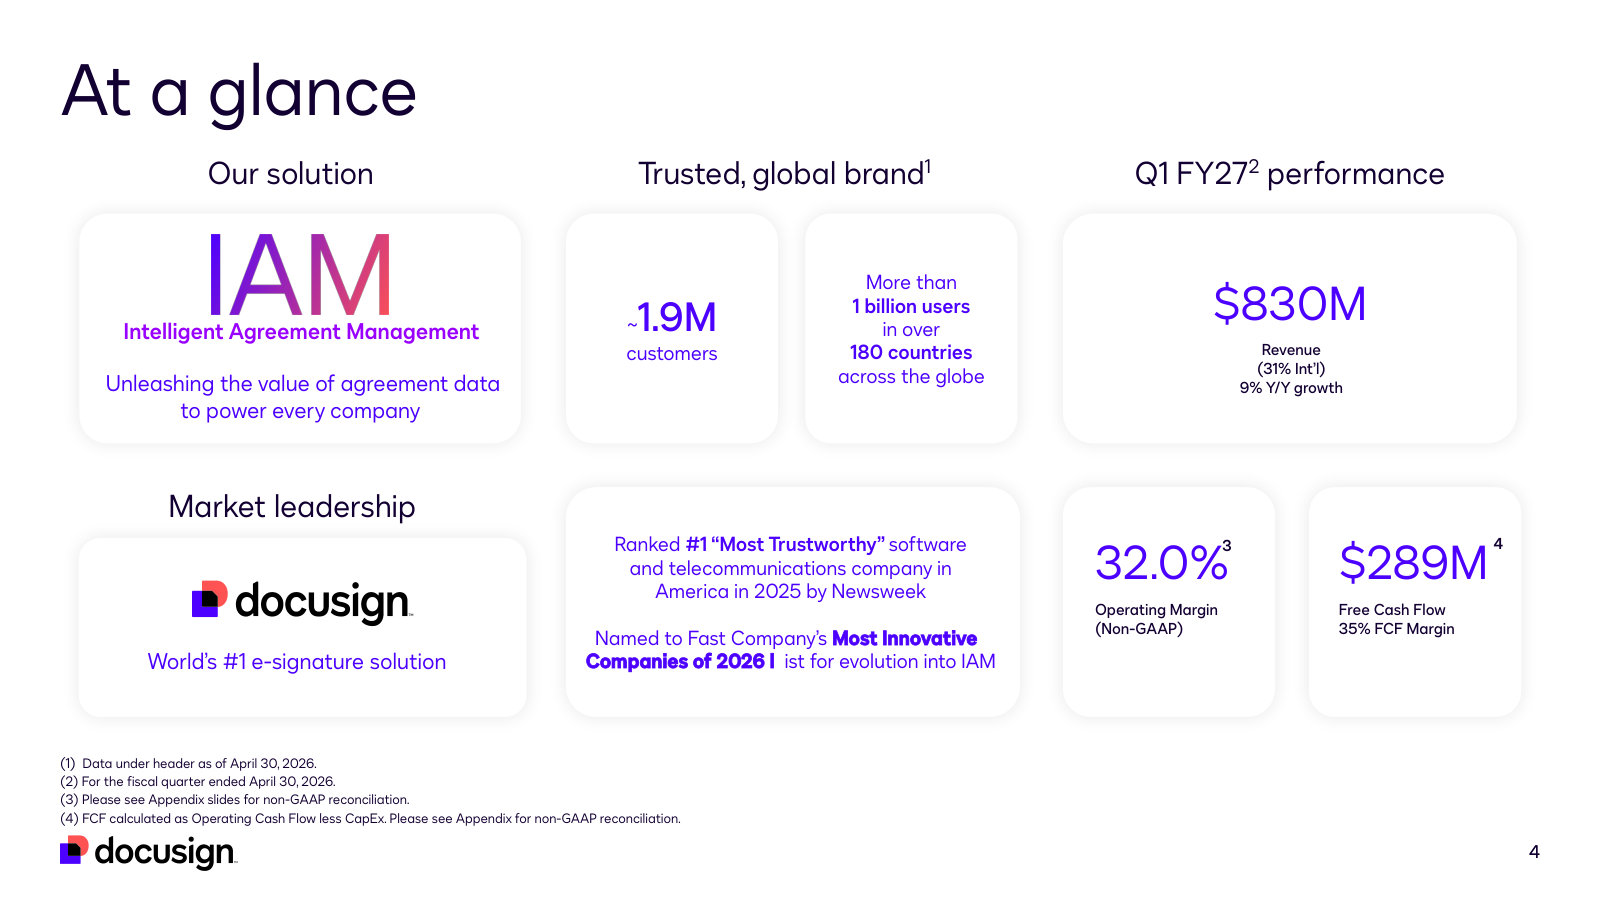
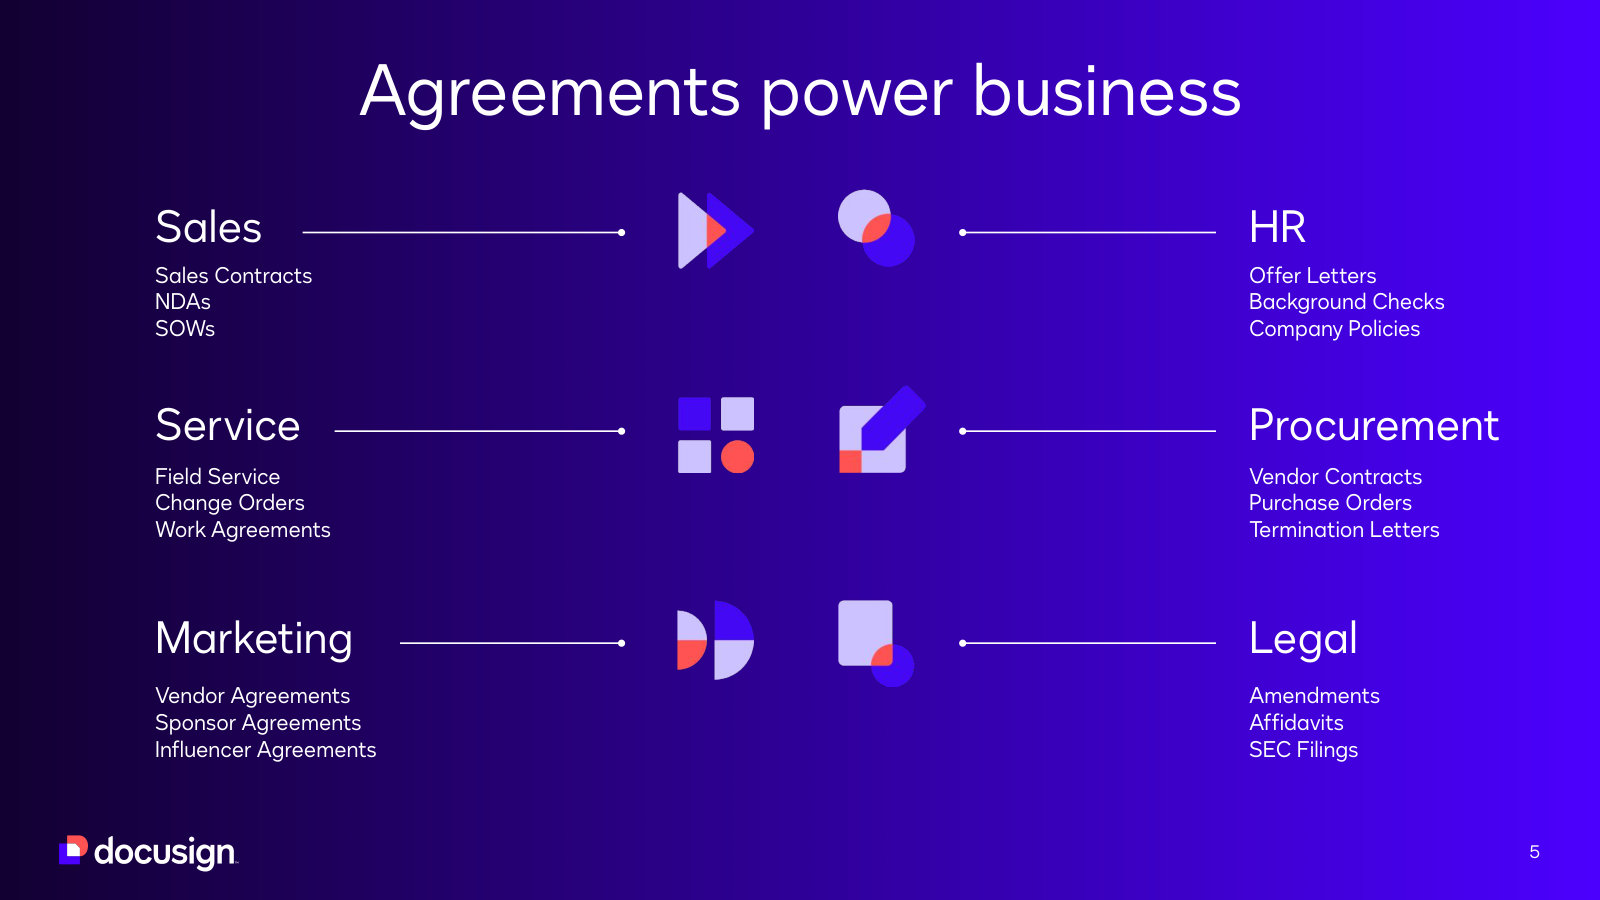
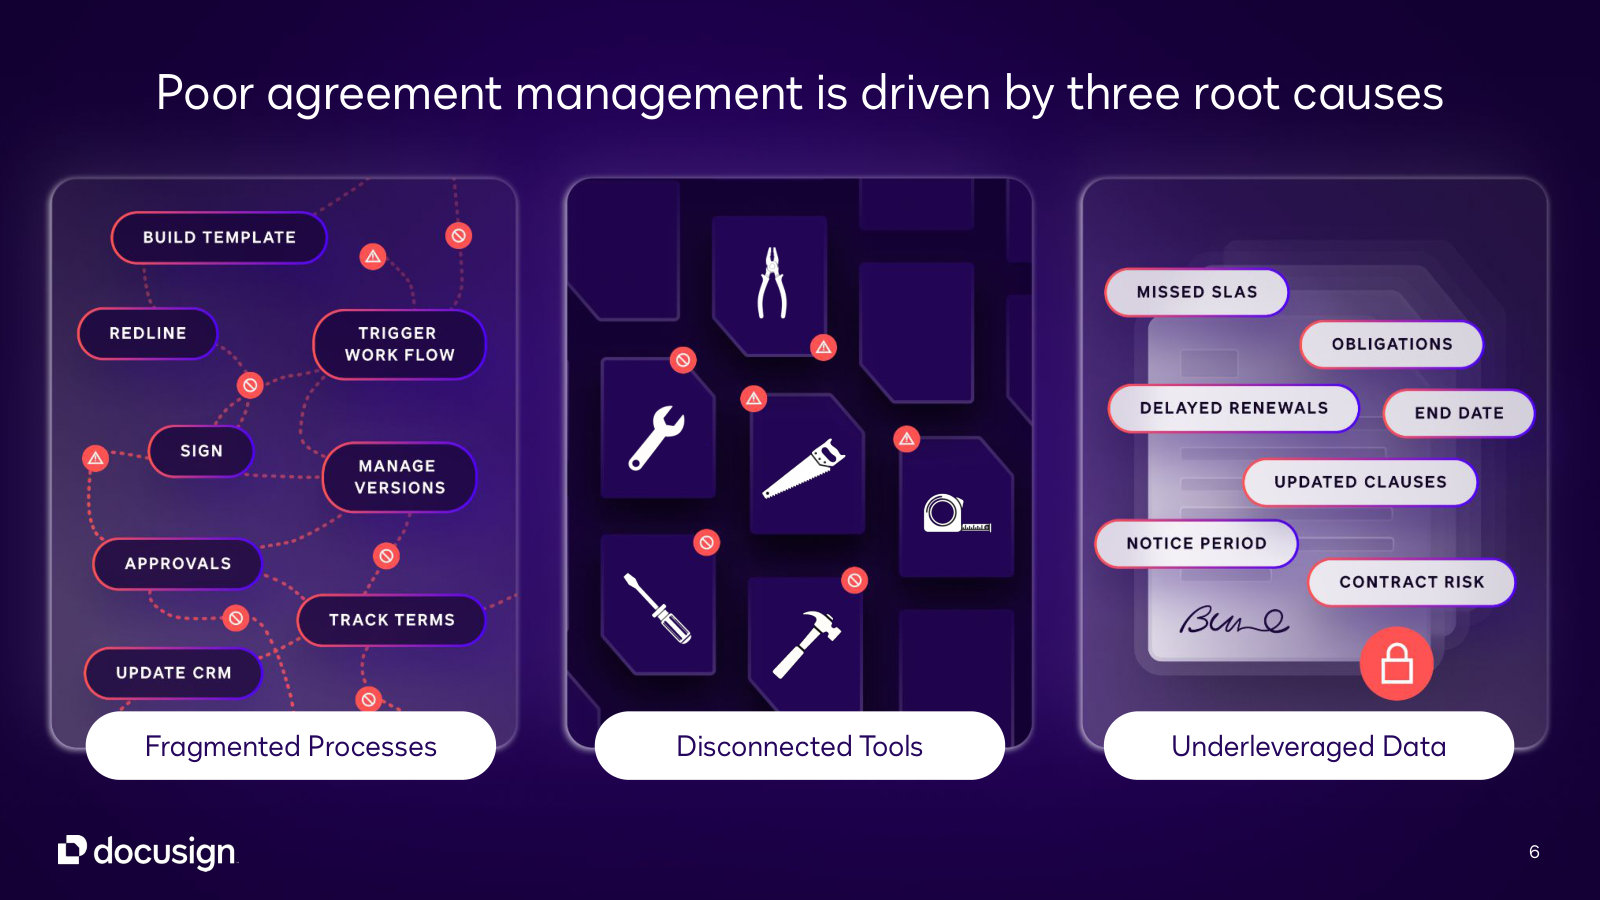
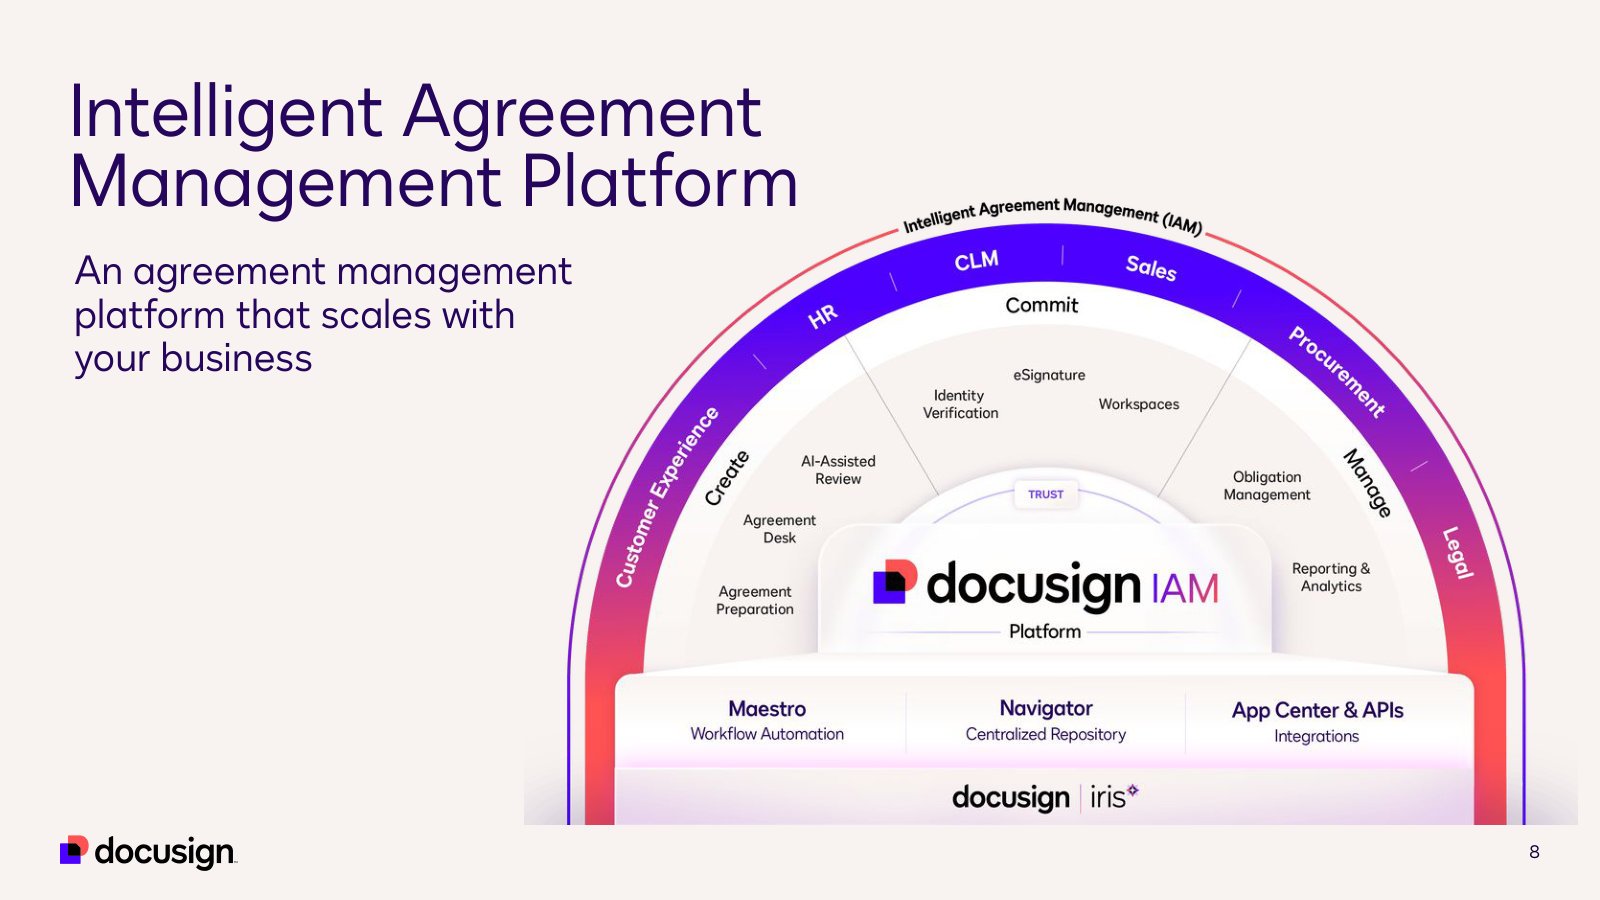
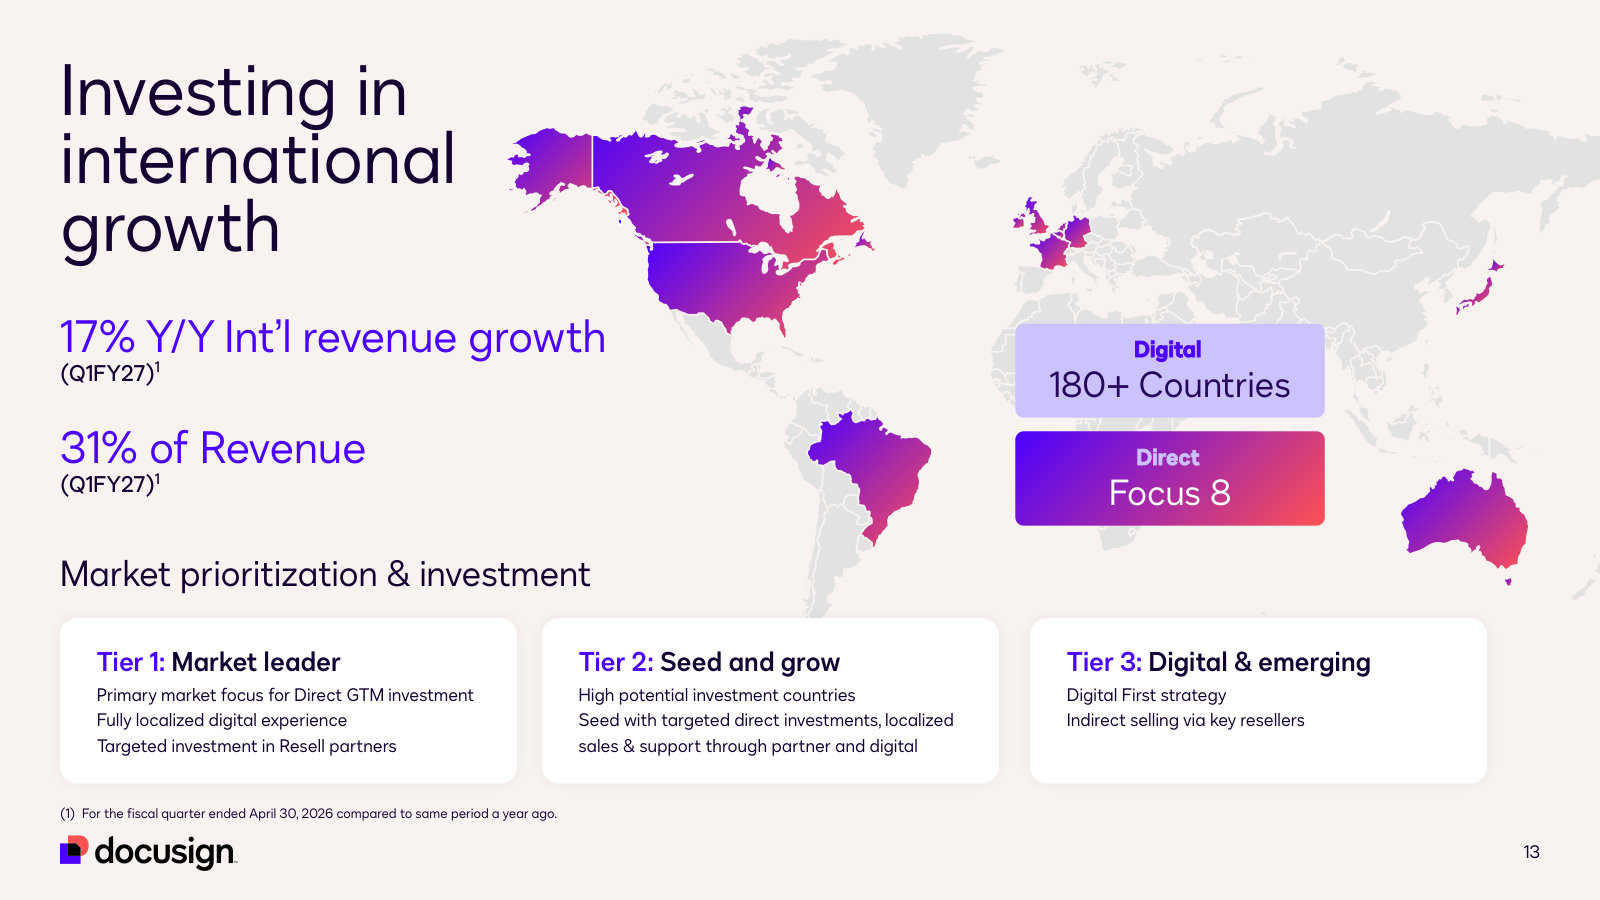
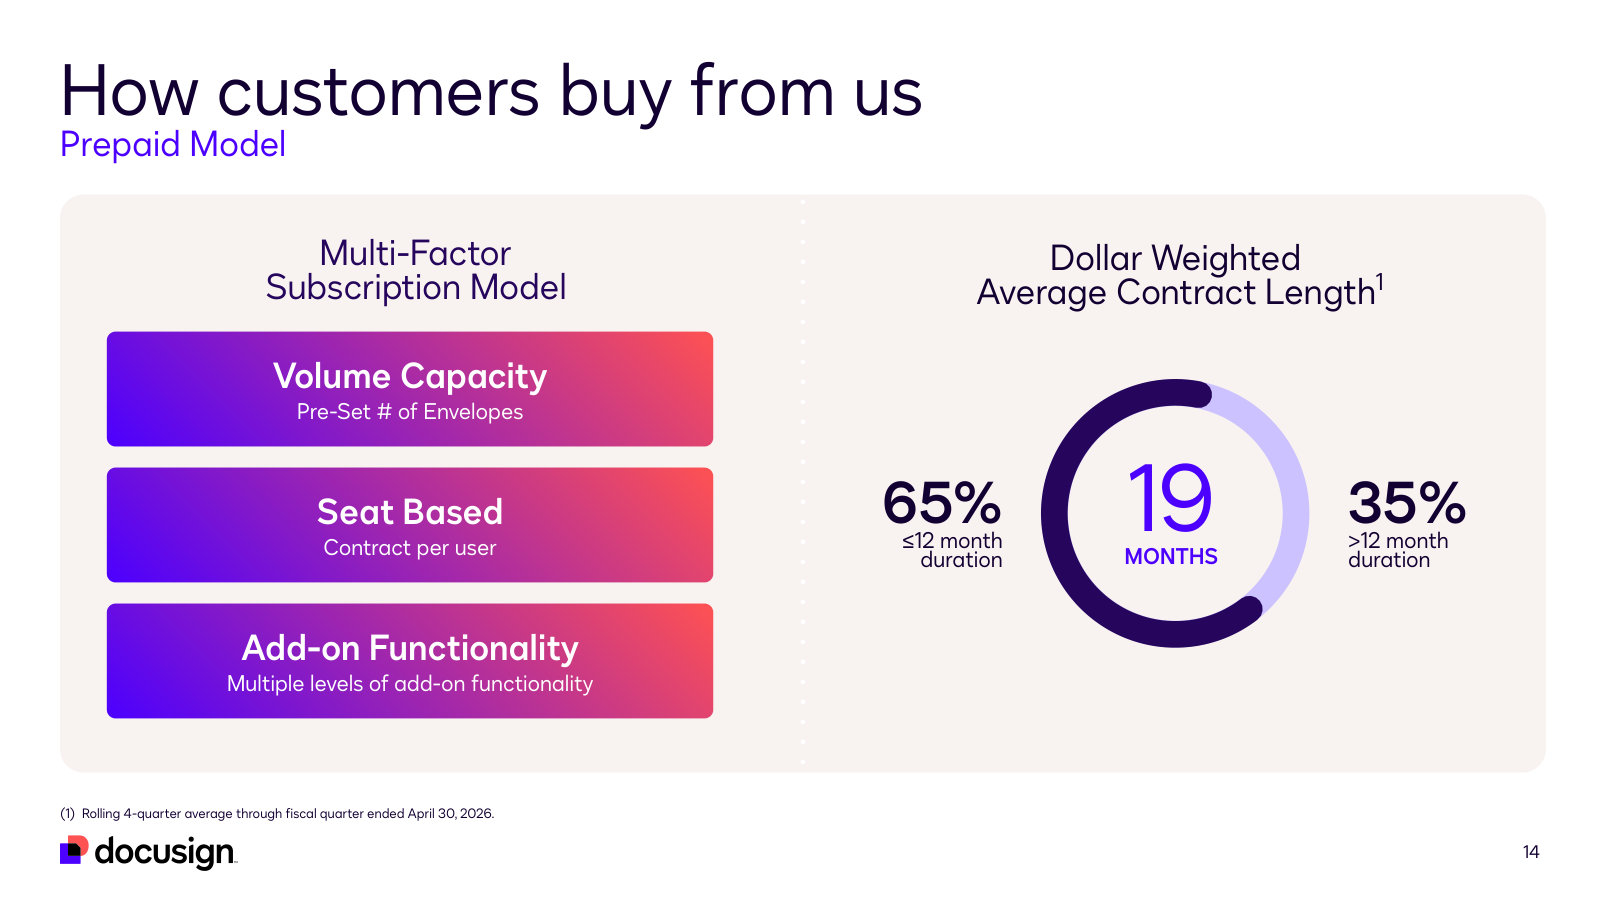
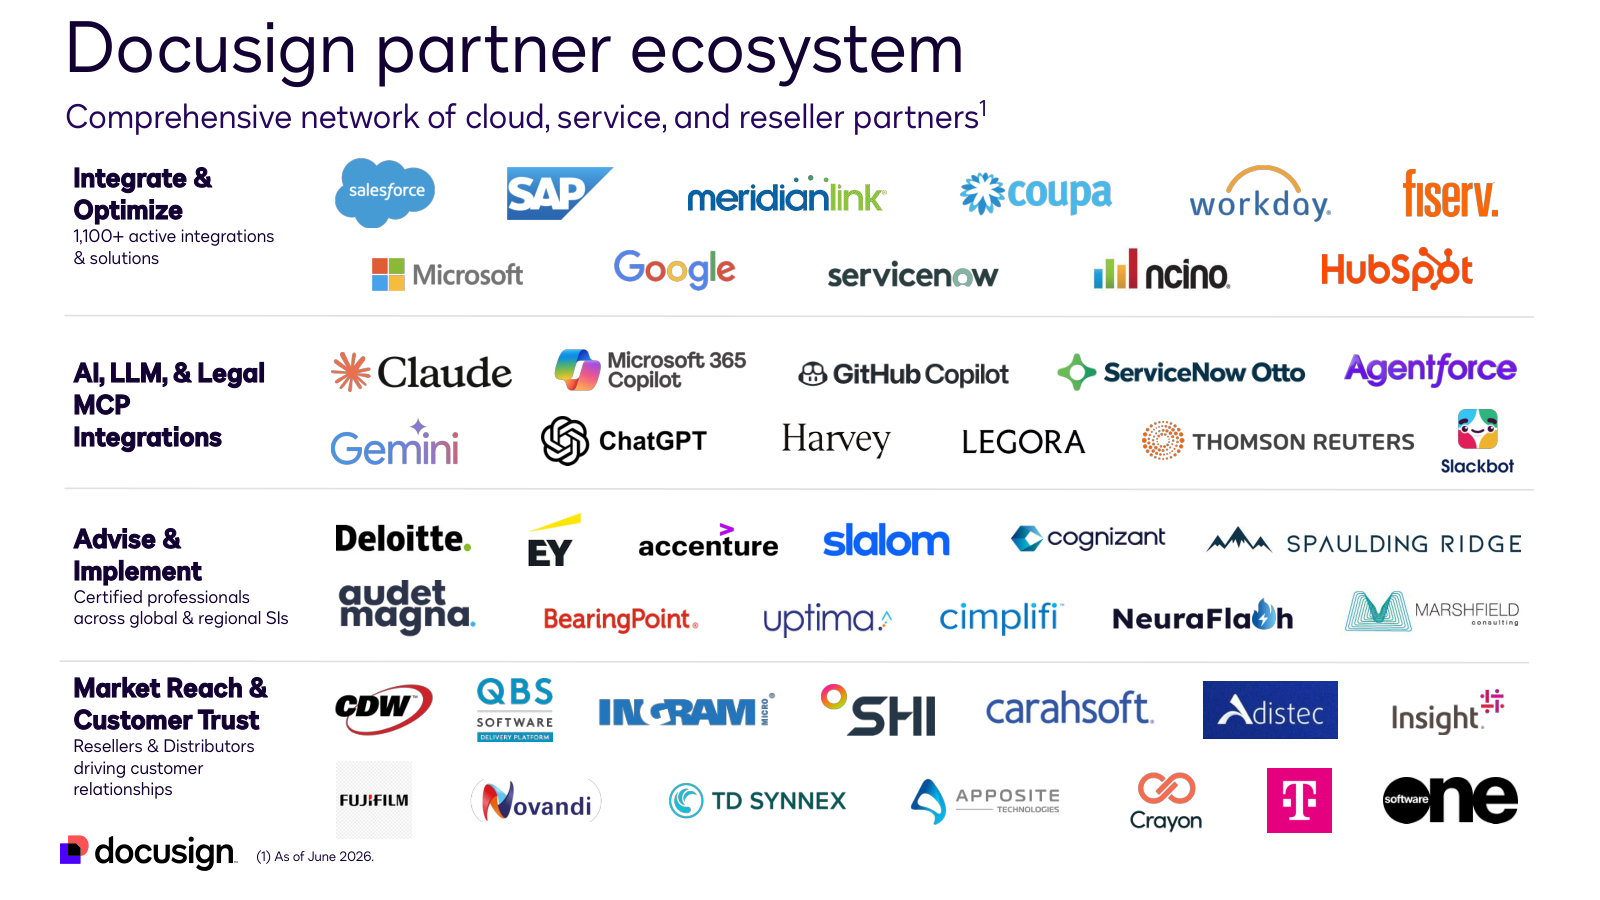
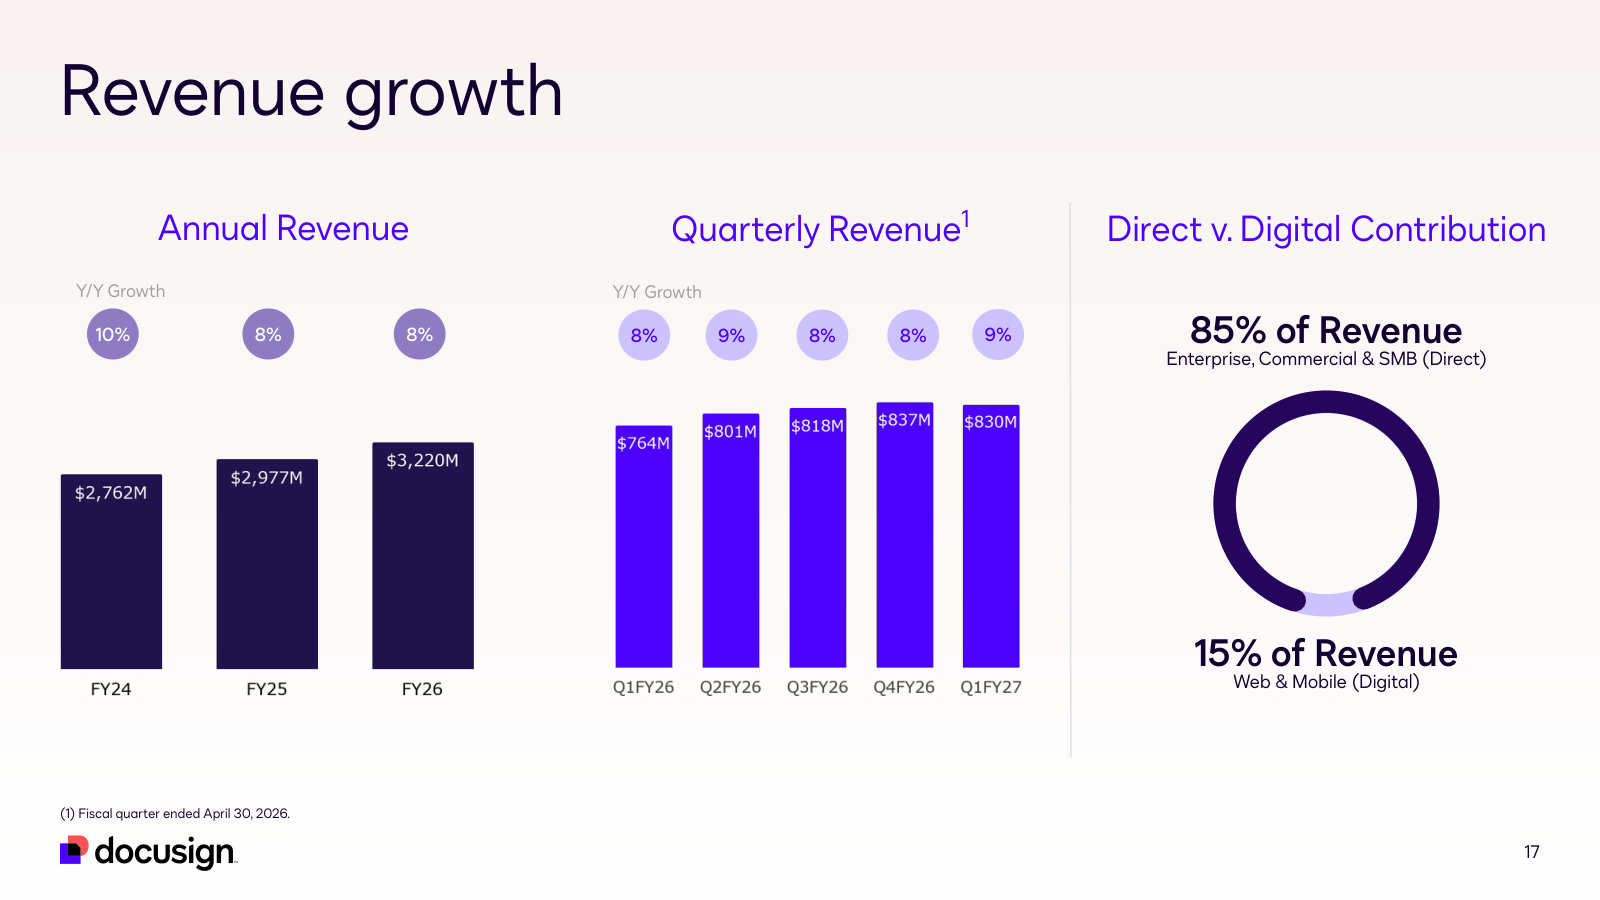
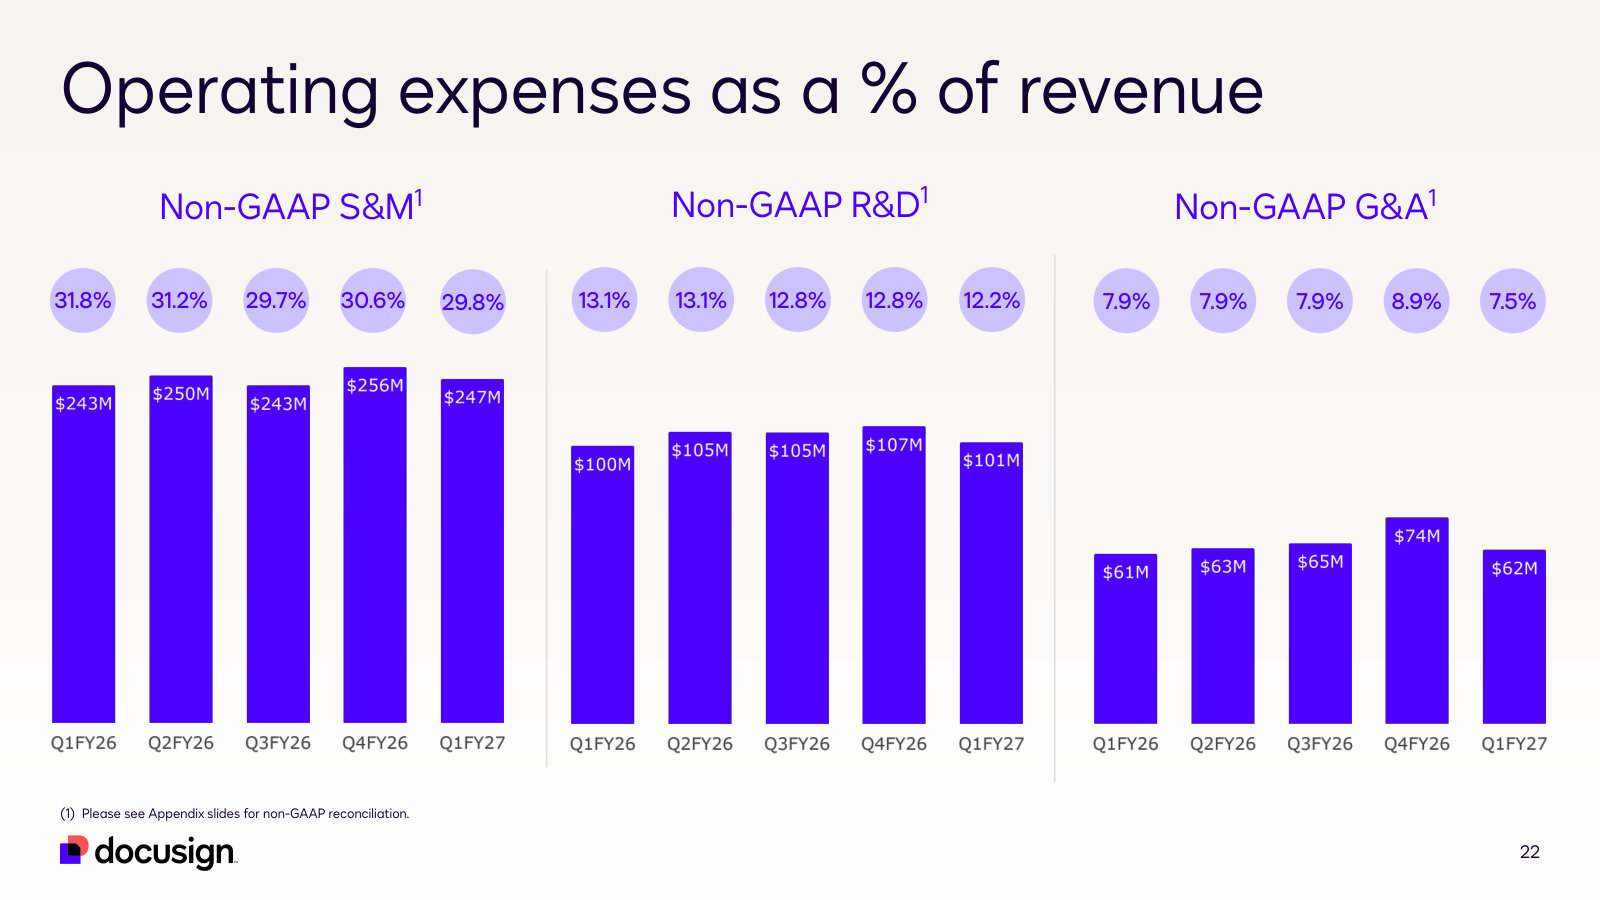
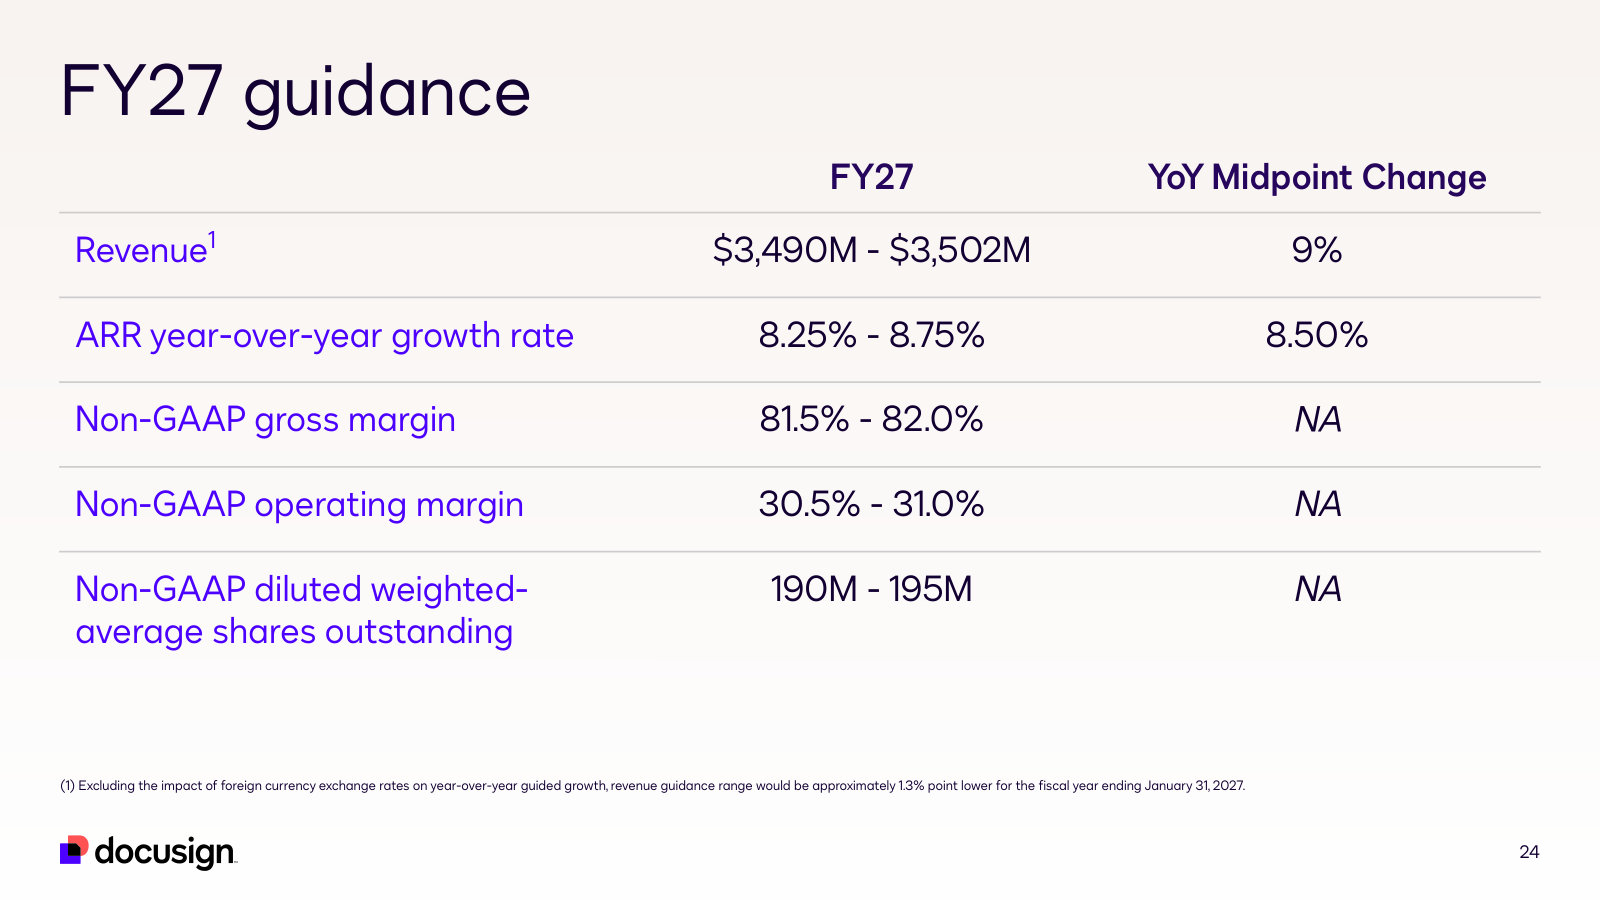
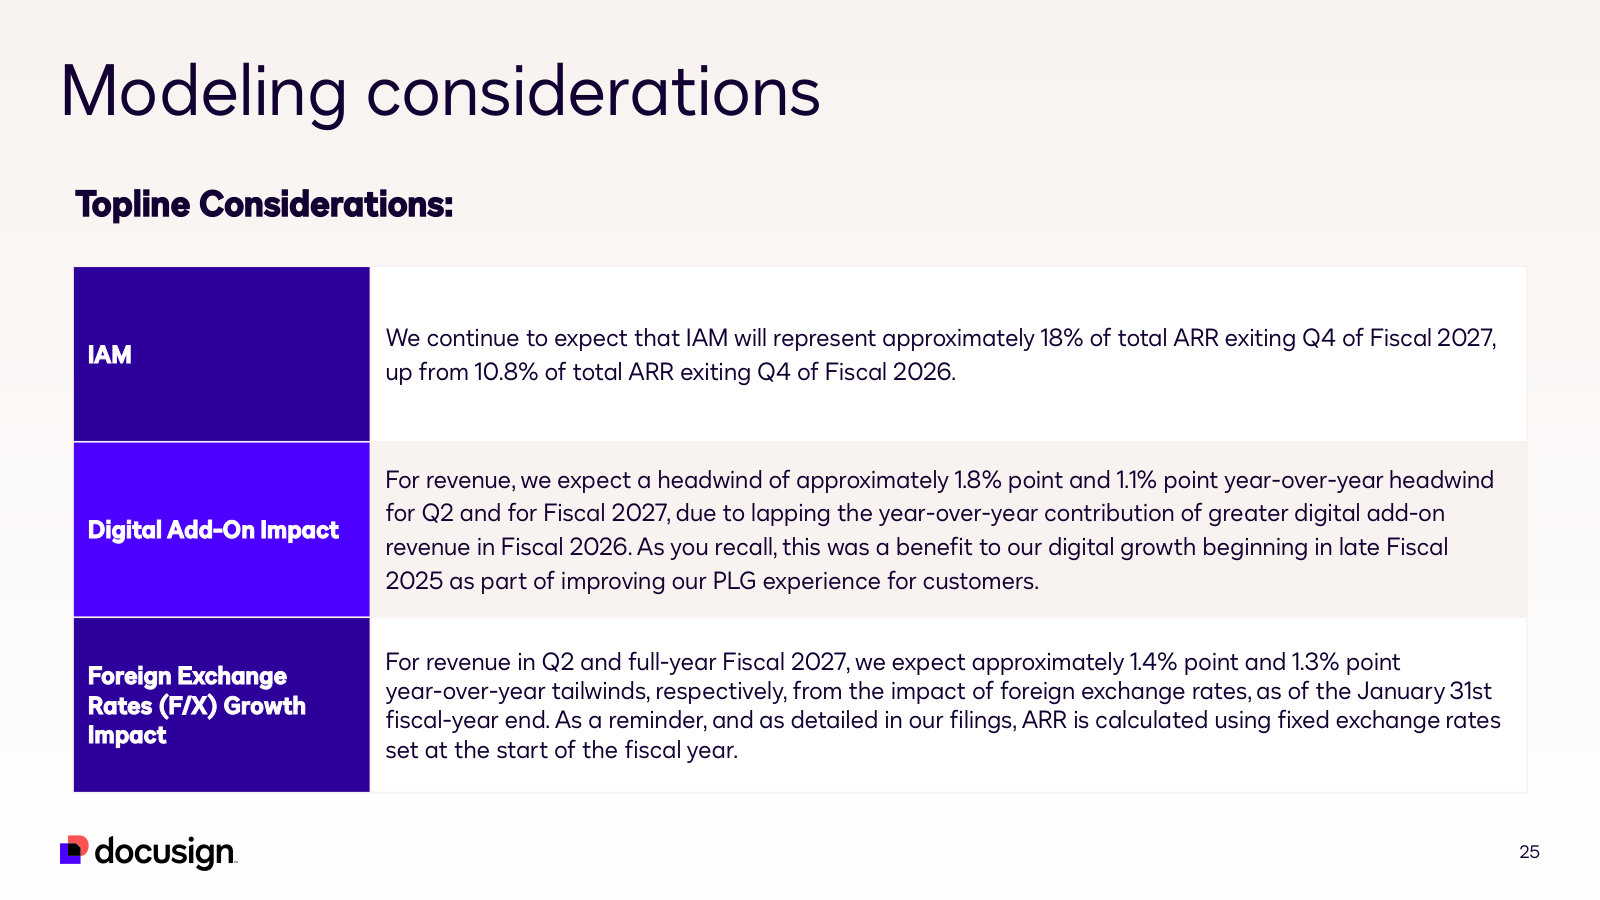
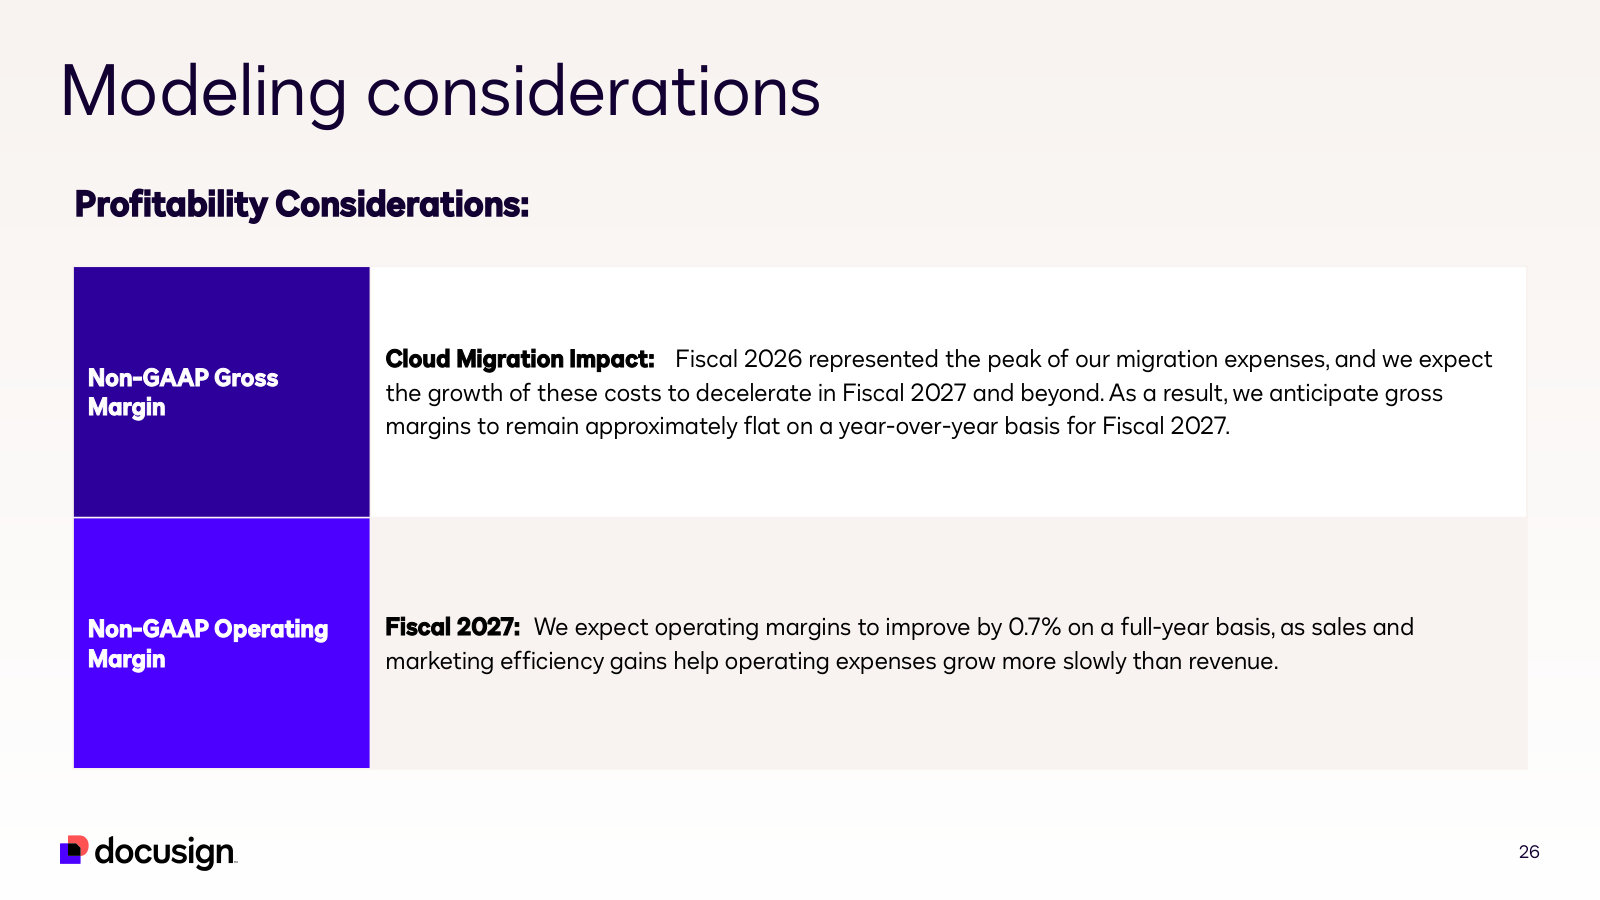
The current company overview: what agreements are, what IAM does, how Docusign sells it, and the financials as they stand. · Open the full document →
Investor Presentation — Q2 FY25 — Q2 FY25
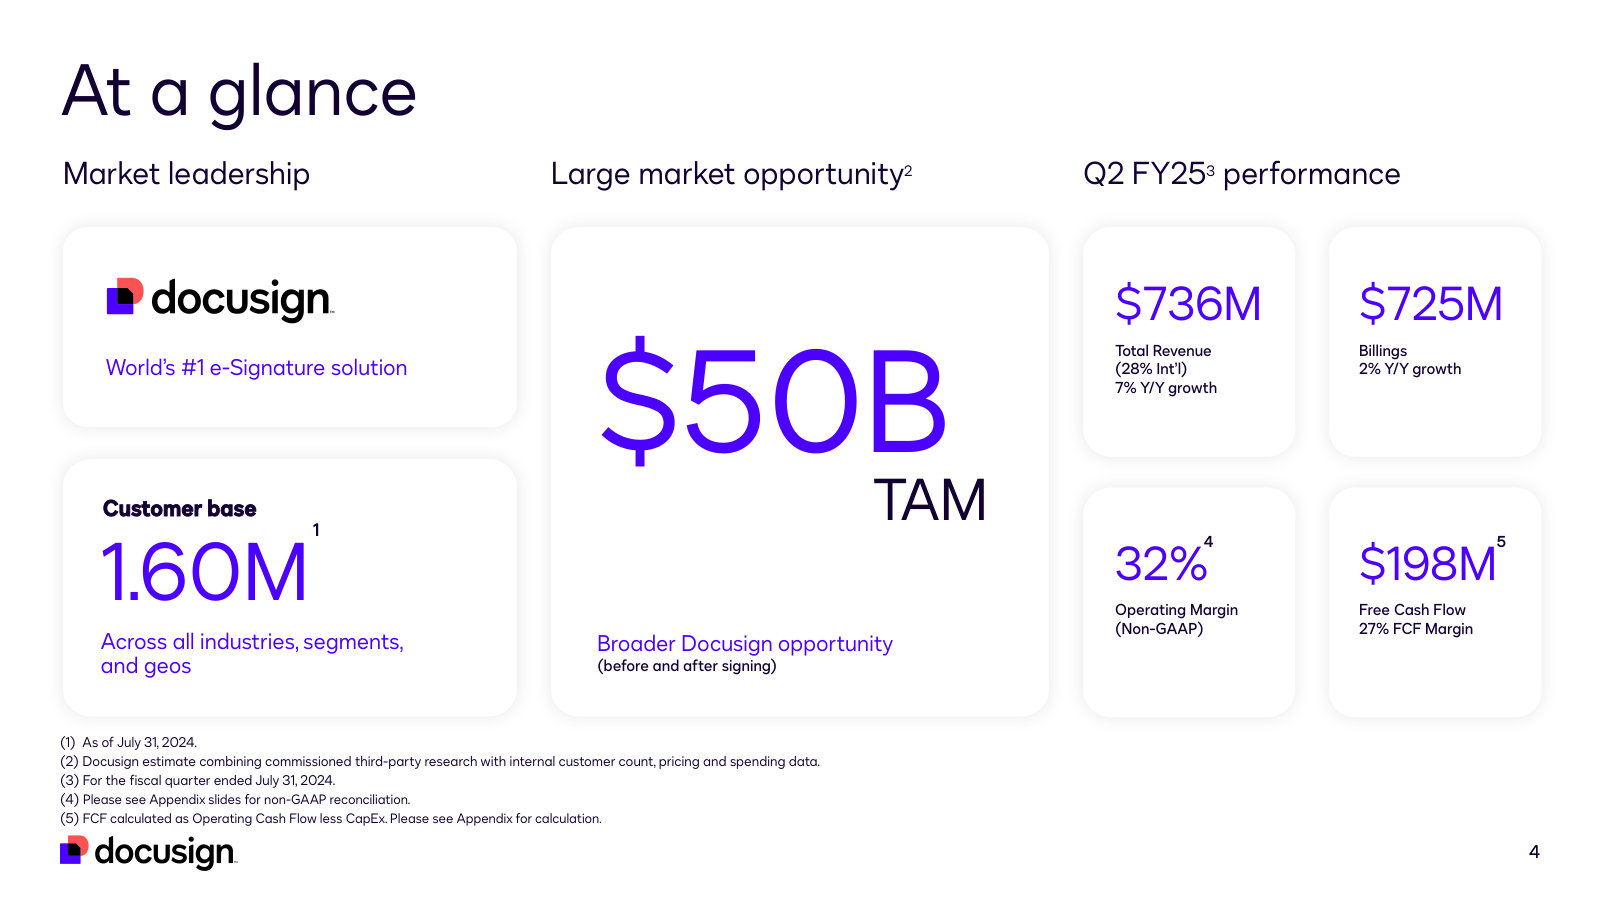
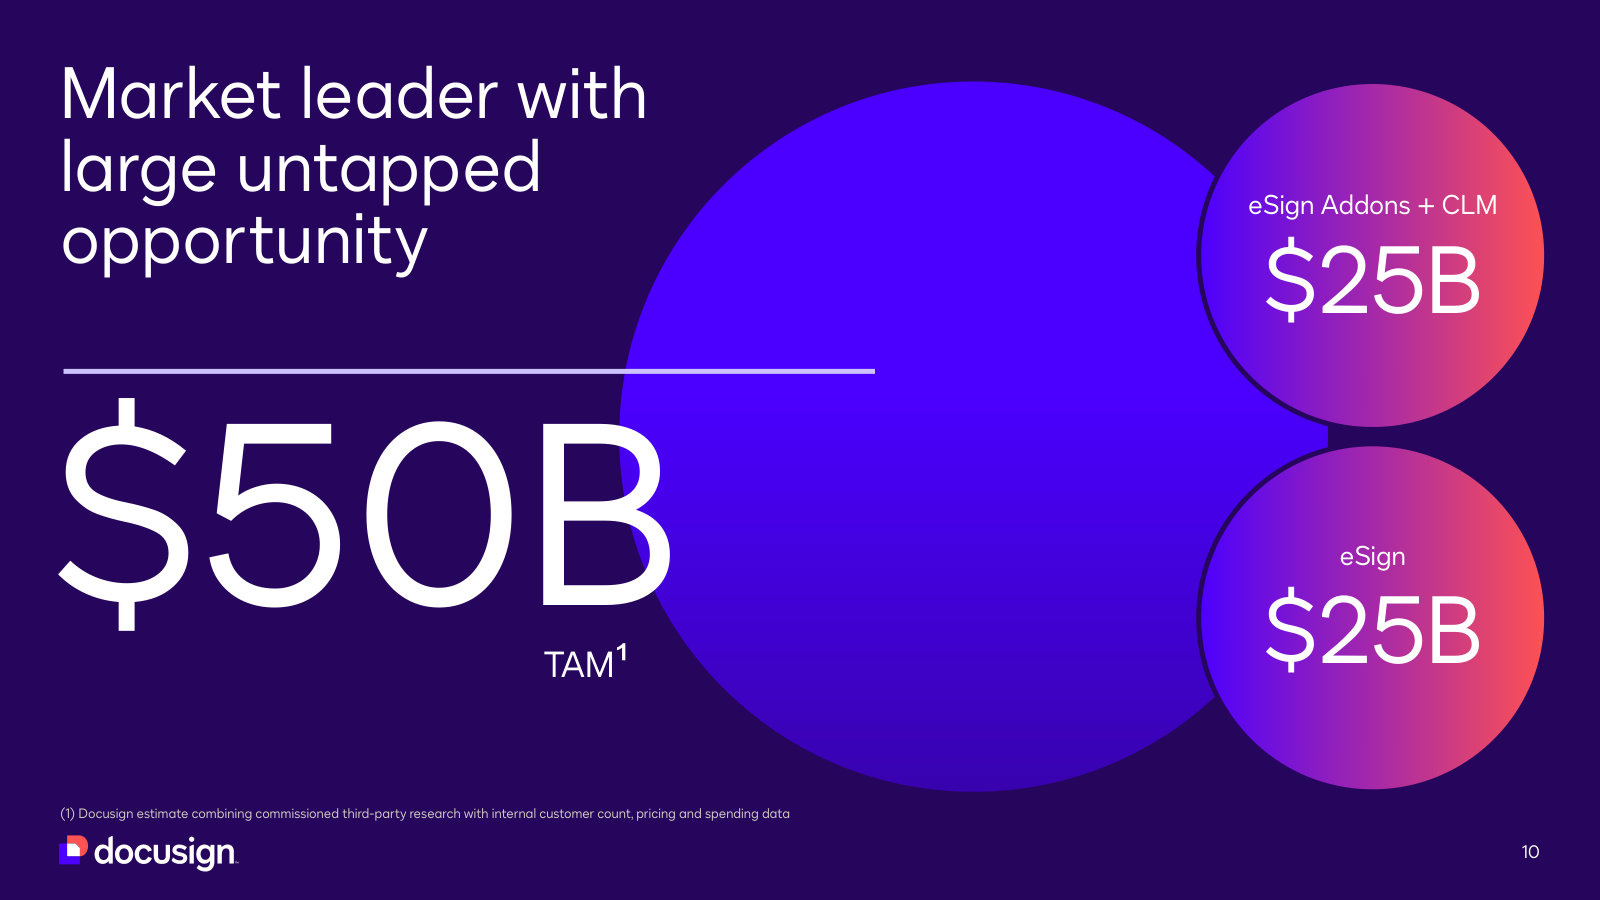
The deck from the IAM launch year and the last generation to size the market — the addressable-market case newer decks drop. · Open the full document →
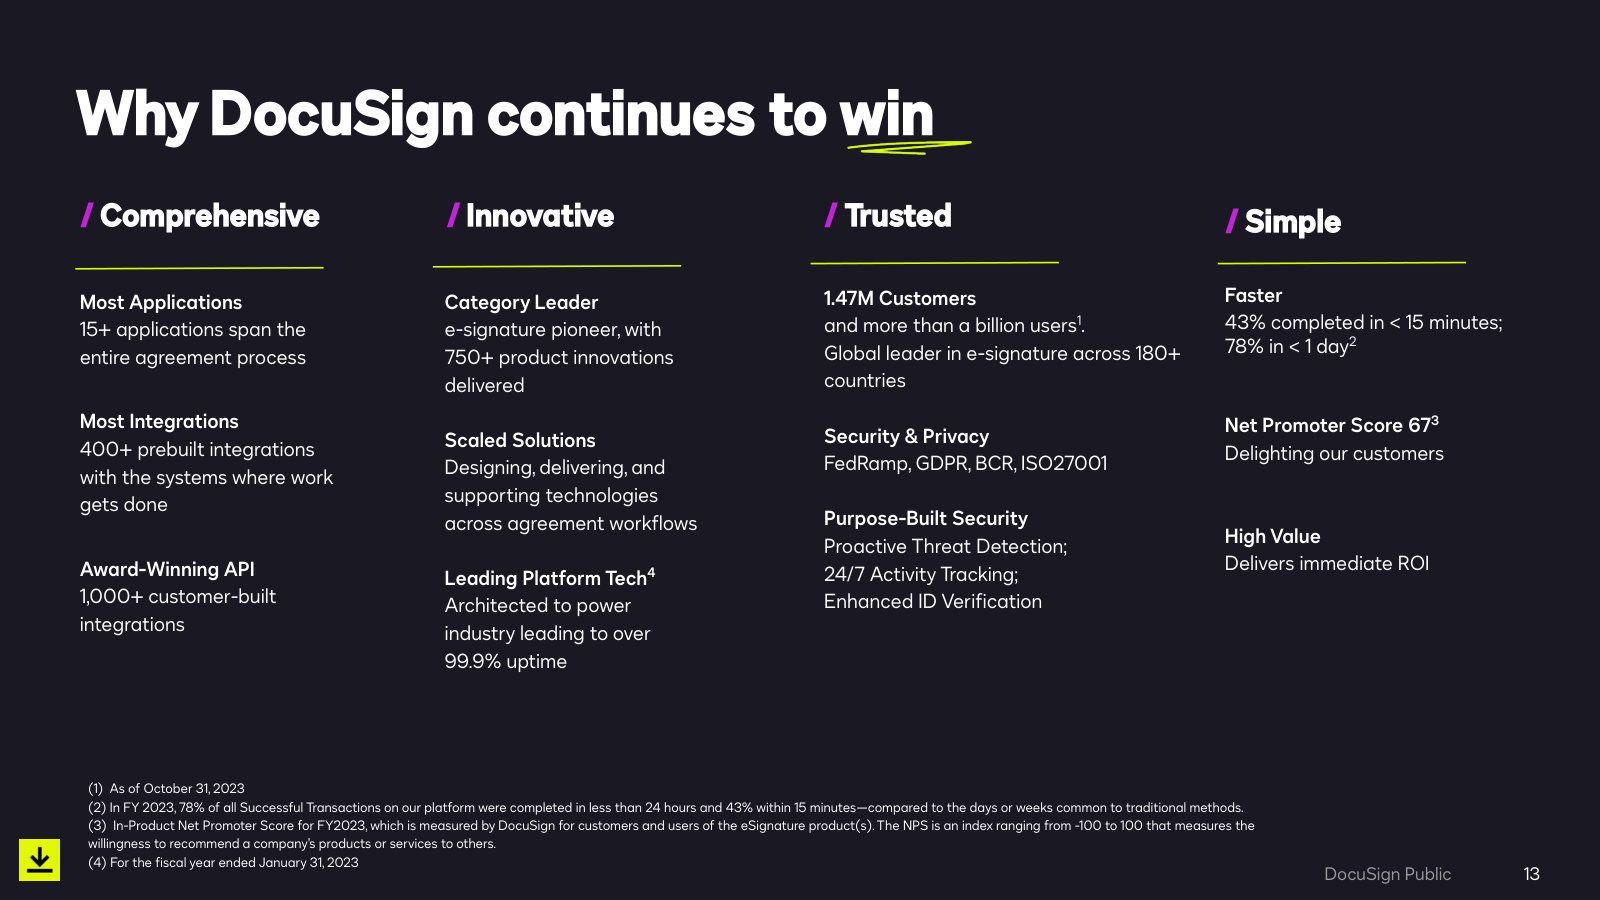
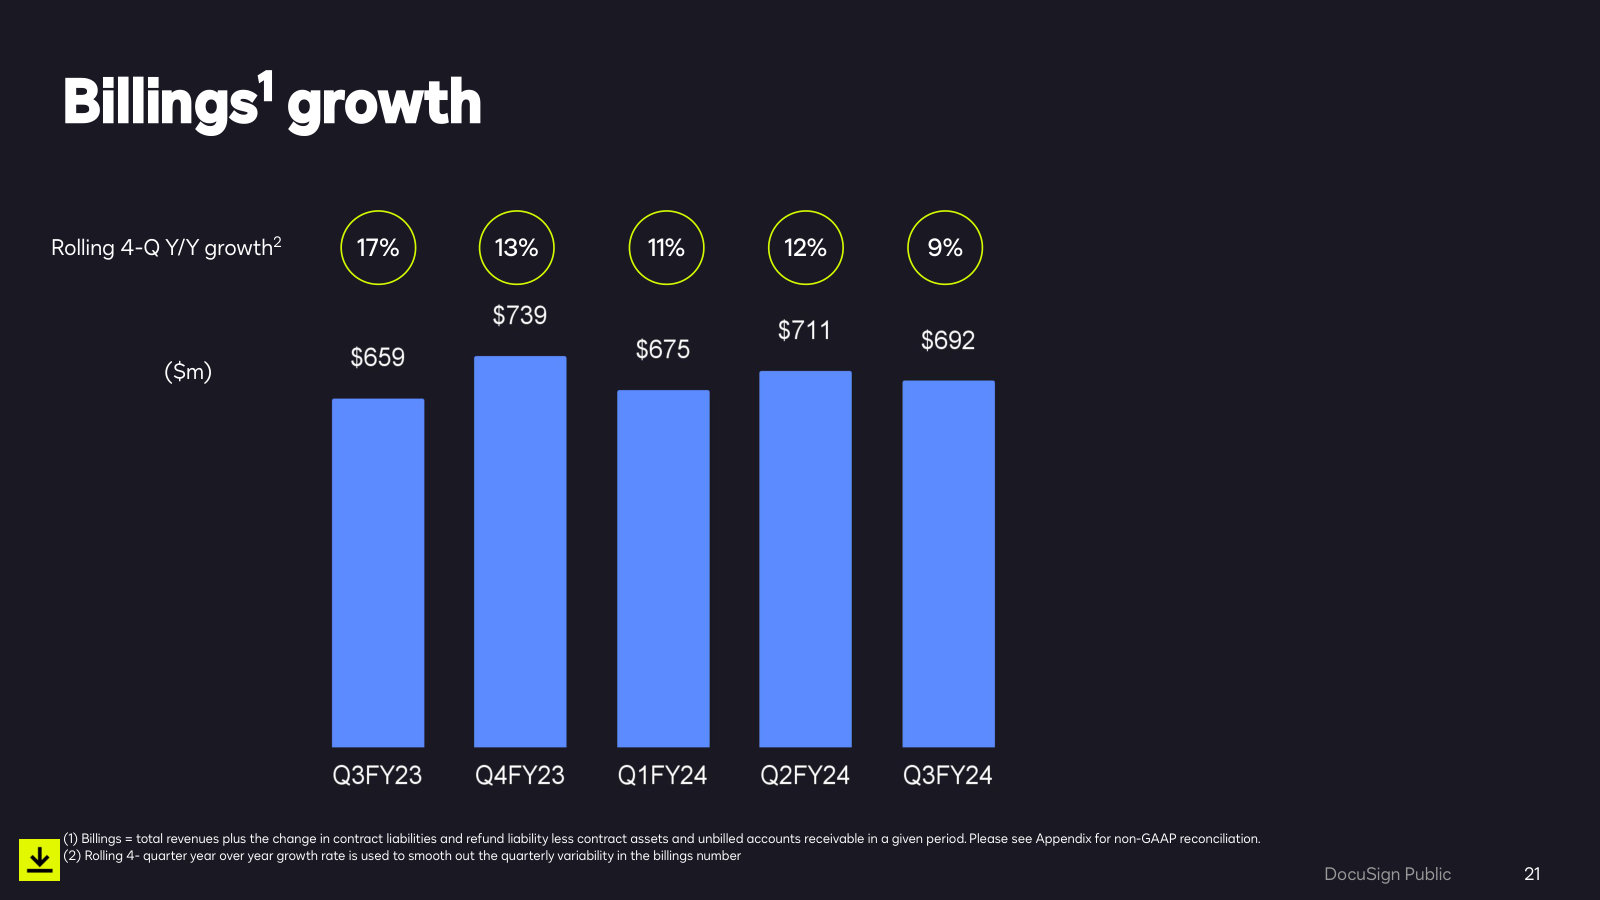
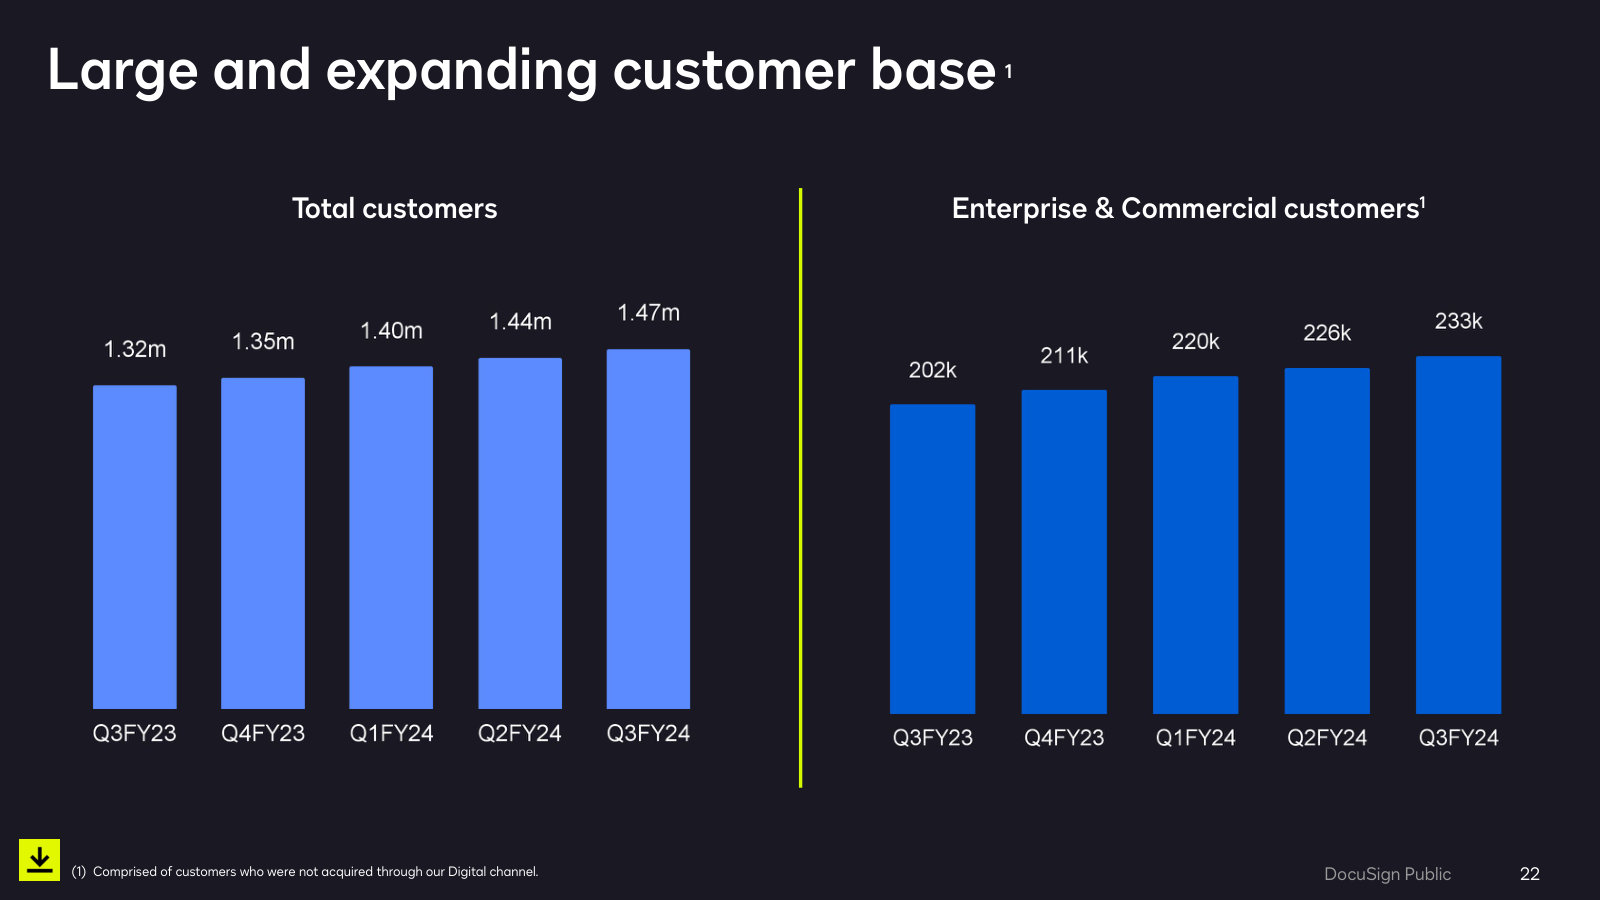
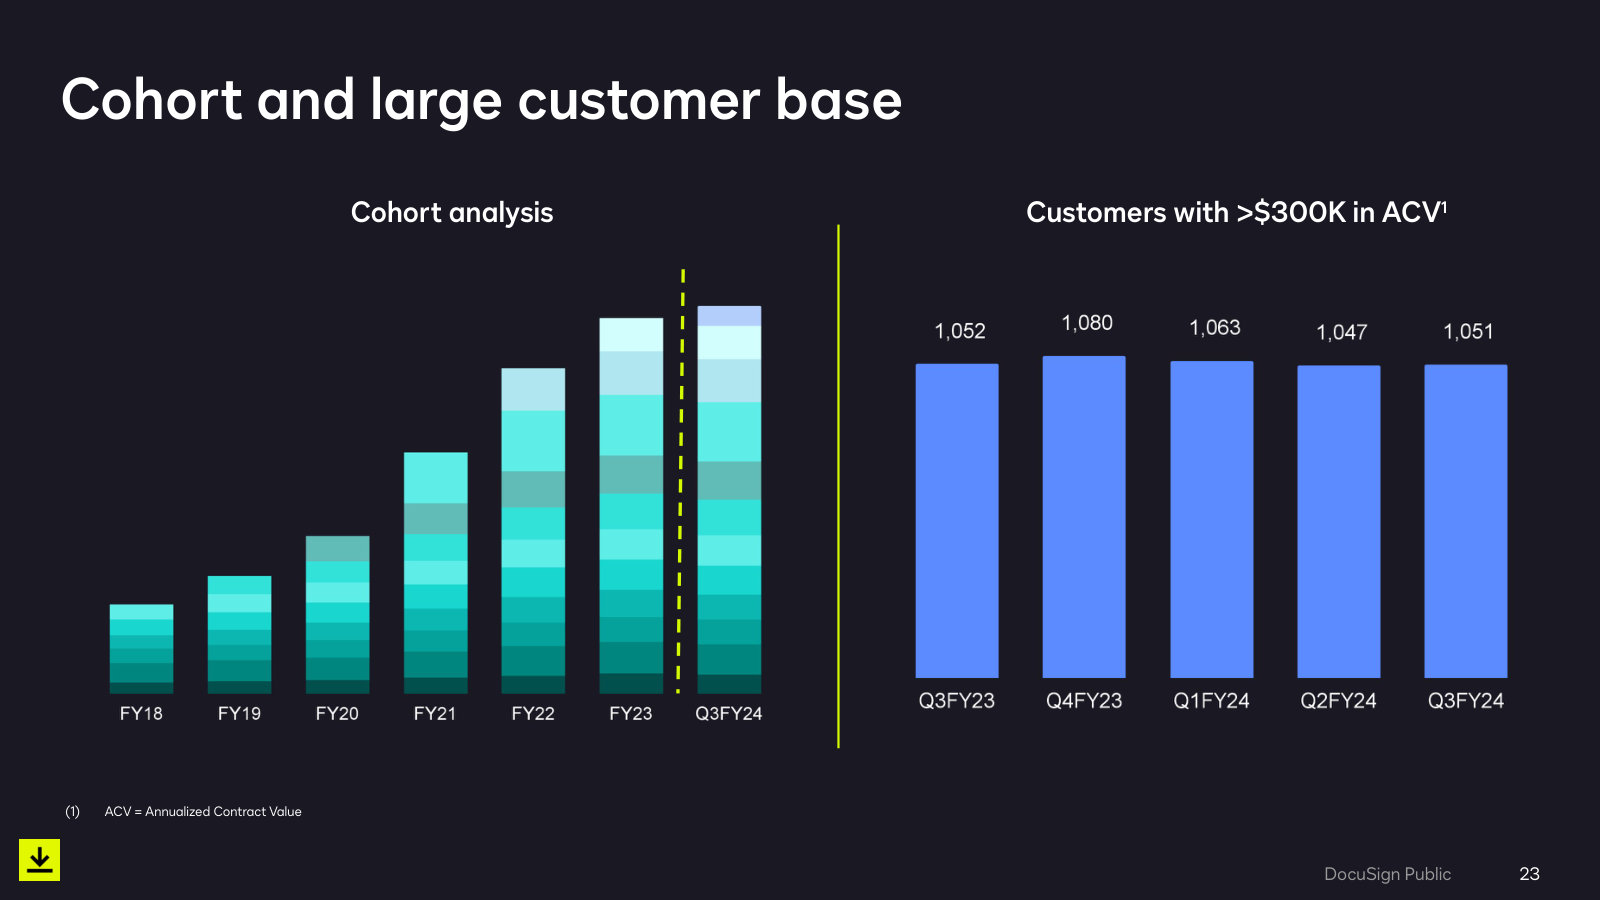
Investor Presentation — Q3 FY24 — Q3 FY24
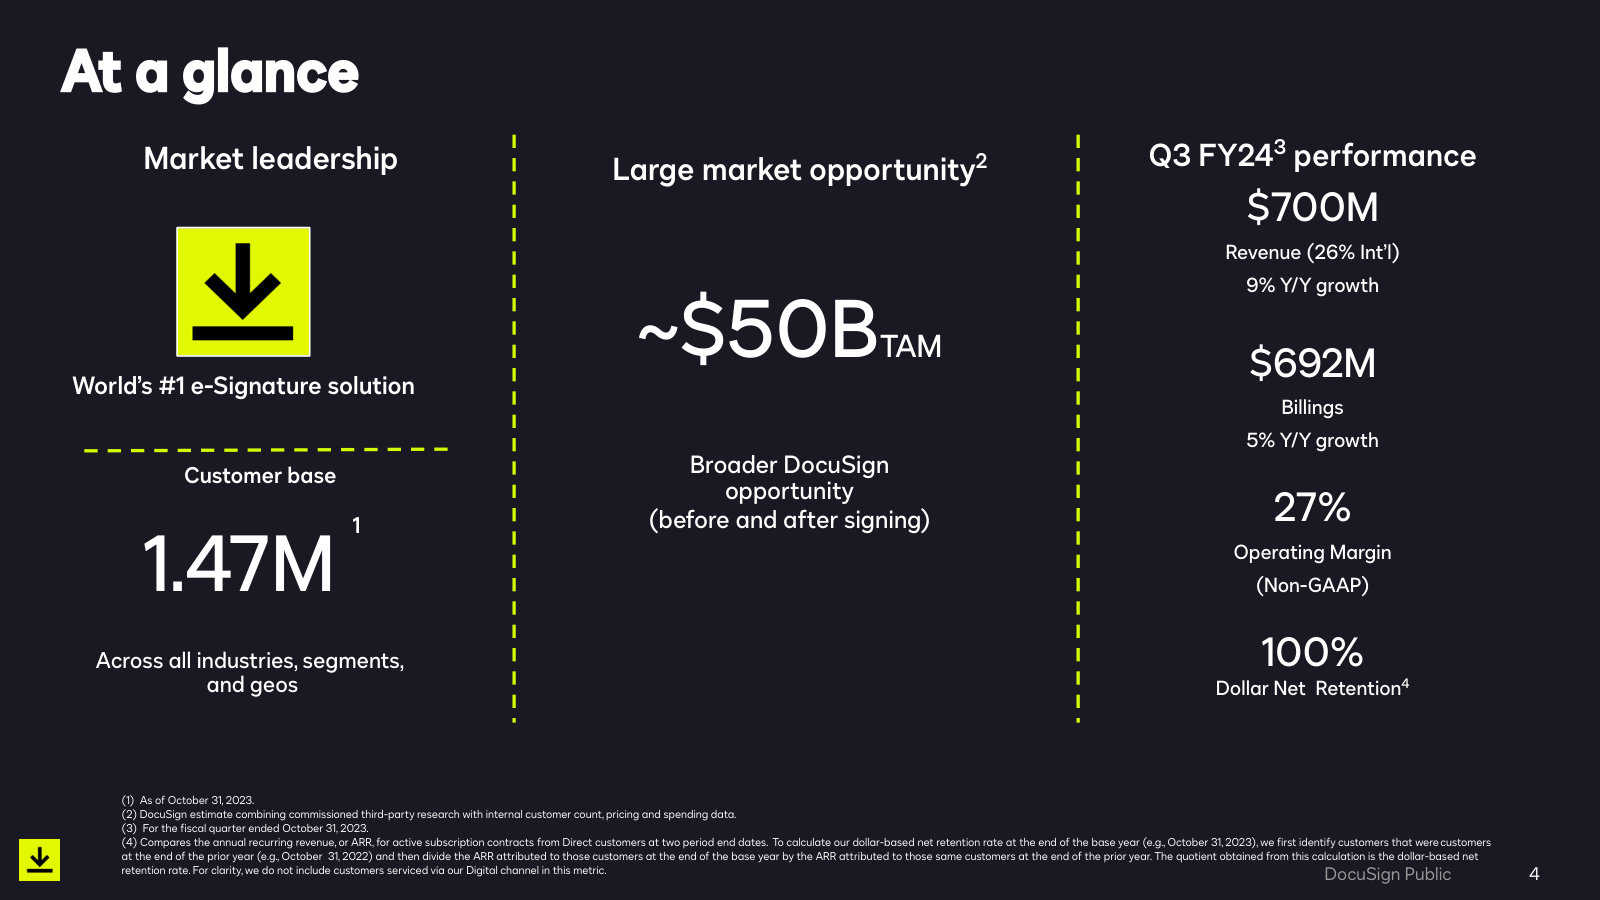
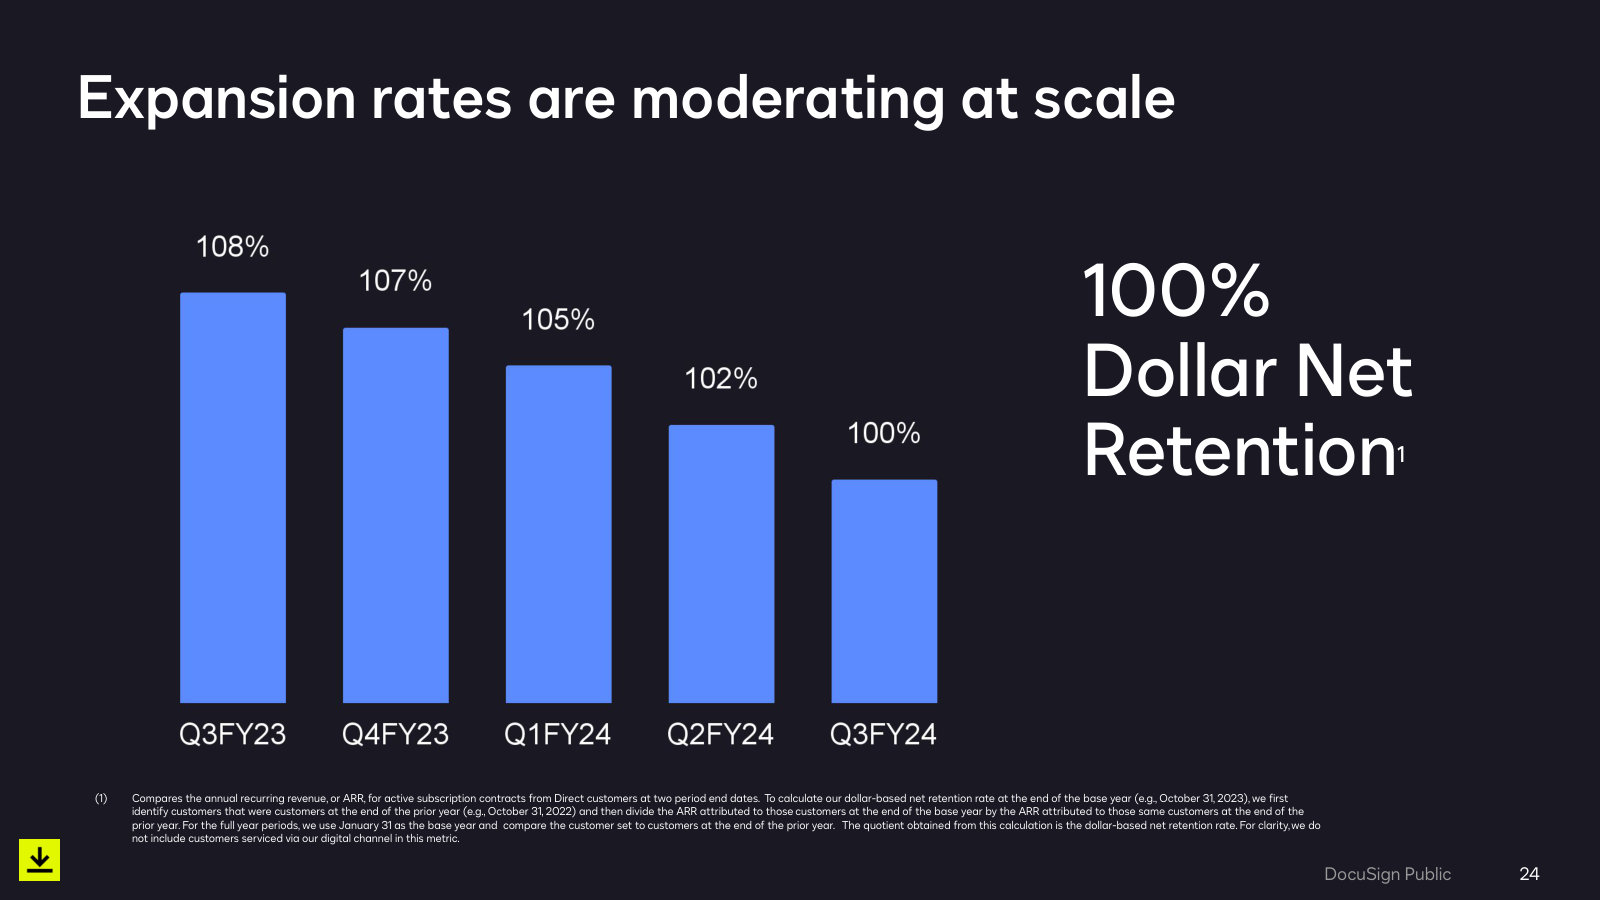
The pre-IAM e-signature company, and the last deck to disclose cohorts and net retention as growth slowed. · Open the full document →
More from management
Investor Presentation — Q4 FY26 — Q4 FY26 · 36 pages · Full-year FY26 results, the first year-end ARR disclosure, and the FY27 guidance management is now being measured against. · Open →
Investor Presentation — Q3 FY26 — Q3 FY26 · 35 pages · The last deck to guide billings before the metric was retired, with IAM adoption still described as 25K+ customers. · Open →
Investor Presentation — Q4 FY25 — Q4 FY25 · 29 pages · FY25 results and the initial FY26 guidance — the reset year, one year into IAM and before ARR became the headline metric. · Open →
Investor Presentation — Q4 FY24 — Q4 FY24 · 33 pages · The last full-year deck before IAM launched — the e-signature-era baseline against which the pivot should be judged. · Open →
DocuSign, Inc.'s management answers for the business every quarter. These are the exchanges that explain it best — verbatim, from the call transcripts preserved in Sources. Each link opens the full transcript at that page in a new tab.
Q1 Fiscal Year 2027 Earnings Call — Q1 FY2027
The current business in management's own words: where the AI advantage comes from, how IAM is priced, how Docusign positions against the model vendors it partners with, and why growth is still single-digit. · Open the full transcript →
The claimed AI moat, quantified: private consented agreement data for accuracy, 50x cheaper processing.
Allan Thygesen (CEO): Docusign’s significant advantage in agreement AI enables IAM to deliver superior performance. Our AI engine, Iris, harnesses frontier LLM intelligence and combines those capabilities with Docusign’s orchestration, deep domain expertise, and unmatched body of agreement data. Hundreds of millions of consented, private agreements have been ingested into IAM, with millions more flowing in every week. We continue to believe we can achieve up to a 15 percentage point improvement in precision and recall compared to our models trained on public contract data, while operating at incredible cost efficiency. We’ve optimized AI processing costs by more than 50x compared to running direct prompts on LLMs.
Our other advantages include enterprise-grade security, an expansive ecosystem of over 1,100 third-party integrations, and long-established global distribution relationships. Our deep understanding of customer workflows and context creates a significant advantage as we integrate agents that can autonomously perform tasks for customers – safely, at their direction, under their control, with Docusign providing compliance guardrails.
p. 5 · Read in context →
The flywheel management is counting on: IAM workflows generate more signatures, which pulls eSignature consumption up.
Robbie Owens (Piper Sandler); Allan Thygesen (CEO): Could you speak in more detail around the difference you're seeing in consumption from customers who are on IAM versus those who are not? I realize it's still early IAM penetrates more of the low end. But as you're moving into enterprise customers, maybe help us understand those differences in consumption, both those on IAM versus those that aren't, and how this changes over time with those that have been using IAM. […] Yes. I'll start, and Blake, feel free to jump in afterwards. Yes, so we are seeing a lift in eSign consumption, which I assume is what you're referring to—from customers who adopted IAM relative to their prior trend line. It's significant, and we're not disclosing the exact percentage, but it's meaningful. It just reinforces the macro point that eSign is a core component of the overall IAM platform and is an enabler ,and in turn is also enabled by many of the workflow components in IAM. So for example, if you make it easier to create a new agreement workflow that culminates in a signature, then you can generate more signatures.
p. 8 · Read in context →
The answer to why the model vendors will not simply take this market: data, cross-functional workflow, trust, distribution.
Michael Turrin (Wells Fargo Securities); Allan Thygesen (CEO): The data advantage that we are—we have access to customer agreements. They have historically trusted us with those agreements. We now have getting additional consents to process them with AI. We're well over 200 million private consented agreements that are being processed with AI and that gives additional accuracy and texture and we've cited some of the increased accuracy potential that, that data provides. Then you’ve got all the workflows to touch agreements across every function. So this isn't just about making legal more efficient—that's super important—but everybody who touches agreement, sales, procurement, HR, finance, others that do that. I think Docusign stands alone in terms of the breadth of its portfolio there.
And then lastly, there's the trust piece. People have trusted us with agreements. Historically, we have all kinds of regulatory and compliance strengths relative to other providers and that's why people choose to host their agreements on IAM and process them that way. […] In terms of the partnerships with the LLMs, we're thrilled to be partnered with Anthropic. We just announced this week a partnership with OpenAI, and we really want to make our data and workflows available wherever people want to do their work. This has always been core to Docusign's strategy. Already with Sign, more than half of our total signed volume was consumed via API through integrations with other products. We've had a 20-year partnership with Salesforce, long partnerships with the Microsofts, SAPs, Workdays and others of the world and this is really an extension of that. Now as these chat surfaces become popular, people want to consume agreement data and agreement workflows that way and trigger them there; we want to partner with where people want to be and want to do their work. And I think what you'll see is you'll see some use cases that are general purpose chat engines, like an Anthropic or an OpenAI or Google Gemini. Some that are, should we say, function-specific – Slack is a great example used in a number of companies. And then some that are specifically tailored around invoking agreement workflows and orchestrating, and I think Docusign will be a natural place for that.
But we want to be where customers want to do their work and enable the most powerful agreement suite on the market and that's why we're partnering with them. And by the way, that's why they partner with us because they come to us to get access to those agreement documents there, the agreement workflows and the trust and unique position that Docusign occupies. So in many cases, those are the result of inbound inquiries to Docusign.
p. 10 · Read in context →
The hardest question on the call: three and a half years in, why is growth still not double-digit?
Patrick Walravens (Citizens JMP); Allan Thygesen (CEO); Blake Grayson (CFO): I would love to have seen you guys in double digits by now. IAM is clearly working. But I think on an FX adjusted basis, maybe actually decelerated a little bit quarter-to-quarter. What has been harder than you expected? IAM is clearly working, but what's been harder? […] I don't know that we ever set a timeline. I'm not disappointed with our progress. I'm actually really pleased. I think we have a—it’s an incredible transformation moment for agreements. I think we leaned into that, articulated a compelling new vision and I think we've been right about that.
When I joined, I don't think it was quite clear exactly what shape that opportunity was going to have and what technology was going to enable us to do, but it's I think become more clearer and clearer into focus that there's a very substantial opportunity there.
We are forecasting acceleration this year and I think in years to come. And so I think everyone on the management team, not just me, is feeling very bullish about that. We have an opportunity to compound growth salvation for a while here and so we're leaning into that. […] I'll just add one more thing. On the comment on the decel excluding FX, one of the things you have to look at when you compare us on a year-over-year basis is we not only obviously have FX, but we had some pretty high digital kind of, we'll call it, add-on usage last year. And so we highlighted that as part of kind of a normalized growth rate. If you normalize for those peak numbers that we had last year, I think you'll see the word—it's not actually decelerating. It's pretty similar in line. And like Allan said, that guidance into an accelerating growth rate this year on the back, one of the very large components as IAM, along with retention gains, which we continue to make, I think it's pretty exciting and it kind of a lens to the future opportunity that we have here at Docusign.
p. 12 · Read in context →
Competitive framing: CLM is a narrower market than IAM, and functional specialists are treated as partners, not rivals.
Patrick McIlwee (William Blair); Allan Thygesen (CEO): you are pushing into a space that's relatively competitive, notably with a lot of CLM vendors in the space. Can you just talk about how you feel you're positioned relative to some of those other vendors and broader workflow platforms in the market and what your customer conversations look like when you're in some more competitive discussions? […] Yes. We do encounter other vendors in the CLM space. As you know, there's a number of vendors in the space. I think we're clearly one of the largest and best regarded ones, but there are several. I think the CLM opportunity is significantly narrower than the broader IAM opportunity, right? CLM has historically been focused on, I would say, enterprise contract-intensive use cases, B2B negotiated contracts. And you look at what we're doing and coming at it from a different angle, what some of the new legal tech players are doing, it's a very different take on what's possible with agreements. So I think the competitive set—the market opportunity is much larger than CLM has historically been and the competitive set is evolving. […] I think we are in a very good position to be the nerve center, if you will, for agreements and then call on and connect to other tools as necessary. I think the CLM market, there's still a number of customers who specifically look for CLM solutions and we want to be very competitive for that, but we also want to open their eyes to the broader opportunity with agreements across the enterprise in every function, including things that they might not historically have thought of.
I think we're in an increasingly strong position in agreement management and coexisting with new players who come at, let's say the legal space from different angles.
p. 14 · Read in context →
Where IAM sits on the adoption curve: 40,000 IAM customers against roughly 250,000 direct and 1.9 million total.
Allan Thygesen (CEO); Blake Grayson (CFO): I think that you get some idea from the customer count that we just shared, that that's obviously predominantly commercial customers, but we announced across over 40,000 customers for IAM and we have, let's say, 250,000 direct customers, maybe a little less if you roll up entities that are legally related. So we're starting to—it’s still early. There's still a lot of headroom just in the commercial segment and in the enterprise, we're still even earlier. I think those customers represent an even larger opportunity. We can get the kind of lift that we are seeing in commercial and enterprise in the initial deal and then there's the market expansion opportunity as we go across functions into additional divisions because you typically don't go from 0 to 100% in a large company.
So we're quite bullish on the expansion opportunity that IAM offers. We've got a lot of headroom in our commercial business and even more in the enterprise side. […] I might just add on top, as far as our new customer growth goes, IAM is driving a material portion of that and so that's super exciting. It's just that when you have an installed base the size of what Docusign has with a million, almost 1.9 million customers and over 95% of the Fortune 500, that's a big area of ground for us to cover with folks that we already have relationships with.
So I would say, excited about the new company opportunity, but it's just with the size of the installed base that we have, that's a huge opportunity as well.
p. 15 · Read in context →
Q4 and Fiscal Year 2026 Earnings Call — Q4 FY2026
The annual call that reset the frame: first ARR guidance and the philosophy behind it, consumption pricing, and why IAM should be modeled as a platform shift rather than a new product line. · Open the full transcript →
Guidance philosophy stated outright: ARR is a full-year call, revised only when the whole-year bookings view moves.
Blake Grayson (CFO): This is our first year guiding to ARR and I want to provide some context on our philosophy and approach around it. Our guidance represents our current best estimates for both total ARR and IAM's trajectory based on the business data and bookings forecast available today. Therefore, we intend to only revise our ARR forecast as our underlying bookings expectations evolve for the entire year and not necessarily on a quarterly basis. As you are aware, our bookings are seasonally weighted more heavily to the second half of the year, in particular, Q4, which is typically our strongest quarter. As a result, updating our full-year ARR forecast will depend on our visibility later into the year, which will take time to achieve.
p. 5 · Read in context →
What actually drives the FY27 acceleration — expansion bookings plus retention, with IAM still too small to carry it.
Rob Owens (Piper Sandler); Allan Thygesen (CEO): Allan, in your prepared remarks, you talked about being positioned to accelerate the business, and clearly, that's reflected here in the ARR guide. And after two years of consistent growth now calling for modest acceleration. So maybe help us unpack what's underpinning that confidence. You talked about gross retention and net retention. But can you stack rank kind of the delta between the two with IAM playing a role, maybe speak to some of the top-of-funnel activity that you're seeing as well? And lastly, along those lines, the level of conservatism that you have in this guidance relative to prior years? […] Sure. Thanks for the question. Overall, I think we're really pleased with the momentum in the business. That's what's reflected in our guide. We continue to see, I think, very strong adoption of product market fit in the commercial segment and accelerating momentum in enterprise, which represents an even larger addressable opportunity. In terms of the drivers of the growth this year, it's a combination of new expansion bookings and retention. And both are very significant focus areas inside the company. On the expansion side, as I said, it cuts across segments, primarily driven by IAM. And on the retention side, of course, the bulk of the business is in design. And I think we're doing a better and better job on retention there reflected in the increasing DNR rates. We're starting to see a modest contribution from IAM as well, which has even higher retention, but it's still a very small part of the book. So that's not a huge driver this year; of course, it will become more important as we go further out.
p. 5 · Read in context →
Pressed on why IAM's net-new dollars flatten in the guide, and what would actually restore double-digit growth.
Tyler Radke (Citigroup); Blake Grayson (CFO): When we consider the IAM component referenced in your guidance, there's very strong growth this year. You've added approximately $280 million to $285 million of net new IAM in FY '24, which is a significant increase compared to the previous year. However, if we look at your projection for FY '27, it suggests a similar amount of net new IAM. Can you help clarify why this might not continue to grow at that rate? You have several new initiatives in the pipeline, such as consumption pricing and selling to the C-suite. What additional factors do you need to see in order to return to double-digit growth? […] Sure. Thanks for the question. What we saw this year and what we're expecting to see next year, again, it's a pretty linear progression in the IAM share of ARR. You saw us go from 2.3% to 10.8% this year. We're forecasting approximately 18% by the end of next year. A lot of that has to do with renewal cycles, right? So how are we having those discussions with our customers, getting deeper into their business, and a consultative approach around what's right for them? I would just say IAM is tracking as we hoped it would. I'm excited for it to become an even larger percentage of our business over time. It absolutely is a key growth lever for us to get to that aspirational double-digit growth rate. That, combined with improvements in gross retention, which not only are we making those in eSign, but also we are seeing in IAM contribute to that in small shares today just because we're getting our very first renewal cohorts through. But the combination of those two things, I think, helps us reach that longer-term aspirational goal of reaching double-digit growth. So hopefully, that helps.
p. 6 · Read in context →
Consumption pricing defined: service credits, not token billing, and why it is an enterprise-only model.
Allan Verkhovski (BTIG); Allan Thygesen (CEO): Why is IAM consumption-based pricing the right way of monetizing? And what were your top learnings from the quarter in conversations with your larger customers about how much of an uplift you can drive with IAM? […] Yes. Just to be clear, the consumption pricing we're referring to is consumption, if you will, of service credits. It's not a straight-up token type billing model. So you buy a certain amount of capacity. This, of course, is not new to DocuSign, as you all know, better than almost anyone. Our eSignature business has historically revolved around an envelope model. We pre-buy envelope capacity. You can take a business as sort of a generalization of that. Now with all the different ways we can deliver value with IAM, we've basically looked at how each of those products and use cases drive value and create a credit system. We've now used that with 40, 50 customers. They've been very enthusiastic. So both our customers and our sales teams appreciate that model, and so we're now rolling it out next month. And I think that will just power most of our enterprise business going forward. We still think that for commercial customers, simpler pricing model makes sense, but for enterprises where there are so many different ways to deliver value and grow value over time that a consumption-based credit model is the right approach, and that's been validated in the last six months of trialing.
p. 9 · Read in context →
Asked to date the return to 10% growth, the CFO declines to attach a year to the aspiration.
Allan Verkhovski (BTIG); Blake Grayson (CFO): And then, Blake, is your internal timeline for when you can get to 10% top line growth sooner, unchanged or later after this quarter and why? […] Yes. Just to be frank on this, that is our long-term aspiration for us. It is for me in the long term achievable. If we can both grow expansion and accelerate gross new bookings and improve our retention rates, that's something we could do. The when on that is not as important to me at the moment. We're going to go as fast as we can at this company and provide value to our customers. I think it's something we can achieve. It's going to take some time for us, as you can see. But I'm really excited about the opportunity ahead. But as far as the timeline or anything like that, nothing really to share.
p. 9 · Read in context →
Why IAM ARR cannot be modeled as incremental product revenue: it is a replatforming of the installed base.
Alex Zukin (Wolfe Research); Blake Grayson (CFO): If I think about the guidance around ARR, looking at the IAM flat and that implies non-IAM ARR is going to actually get guided to get a lot meaningfully better. So just curious what's driving kind of the confidence? Is that a gross retention dynamic continuing to improve? […] Yes. Let me see if I can answer the question I think in the spirit and the way you're asking it. If you look at the IAM net new ARR and you try to compare it to the company net new ARR, that can be a tricky comparison because the way to think about IAM is really not necessarily as an incremental brand new product, but it's a platform shift, right? Like we have got a lot of people in our—in our—a lot of customers in our installed base that are moving to IAM. And remember, IAM comes with the new signature offer as well. And customers are paying for that. That's part of their IAM deals that they're doing with us. So while IAM has many incremental features on top, it's also driving that platform shift. So I encourage you to think about it because of that as a platform. Use total company ARR when thinking about our absolute dollar growth. For us, retention gains are critical. IAM is one of those big levers for us to be able to do that, that we think that will play out over time, right? Because you've got to get somebody in—a customer to move into IAM, keep them getting excited about it and then renew them as well. And so this is going to play out over years for us. And I think that I'm really excited about it. But along with that, we're making gains in our company—total company retention as well, which, as Allan said earlier, and I think all of you know, it's still predominantly an eSign business. And so for us, those two things matter a lot. I'm really excited to be able to improve upon the gains that we made this year and get even bigger ones next year.
p. 11 · Read in context →
The margin trade being made: after 20% to 30% in three years, efficiencies now fund five named investment areas.
Patrick McIlwee (William Blair); Allan Thygesen (CEO): the flat guidance for operating margins, I understand you're reinvesting some efficiencies from the go-to-market side in R&D. Is there any context you can provide on what those investments are geared towards or what capabilities you're looking at as you invest there? […] We've gone from 20% operating margins to 30% operating margins over the last three years, growing revenue 30%, while we've dropped headcount 13%. So I think DocuSign has been already on some of the improvements that you're all seeking. I think the decision we made in planning for this year is that we're rightsized for the opportunity ahead of the growth acceleration opportunity that we have. That doesn't mean that we're not reprioritizing aggressively inside the company. So we continue to seek incremental efficiency in our go-tomarket motion. We've done a lot there, and there are going to be more opportunities and then we're investing some of that in our product and technology organization. The areas that we're investing in enterprise and AI, continued acceleration of our legal tech roadmap, federal, U.S. federal is a big opportunity for us. So those are examples of things. Security continues to be a key investment area. Those are five areas that got sort of incremental funding on top of baseline, freed up by some of the efficiencies and other functions.
p. 14 · Read in context →
Q3 Fiscal Year 2026 Earnings Call — Q3 FY2026
The call where the scoreboard changed: billings retired, annual ARR introduced, and the reasoning for both laid out in unusual detail. · Open the full transcript →
The reporting reset explained: billings out, annual ARR in, and why quarterly ARR would be just as timing-noisy.
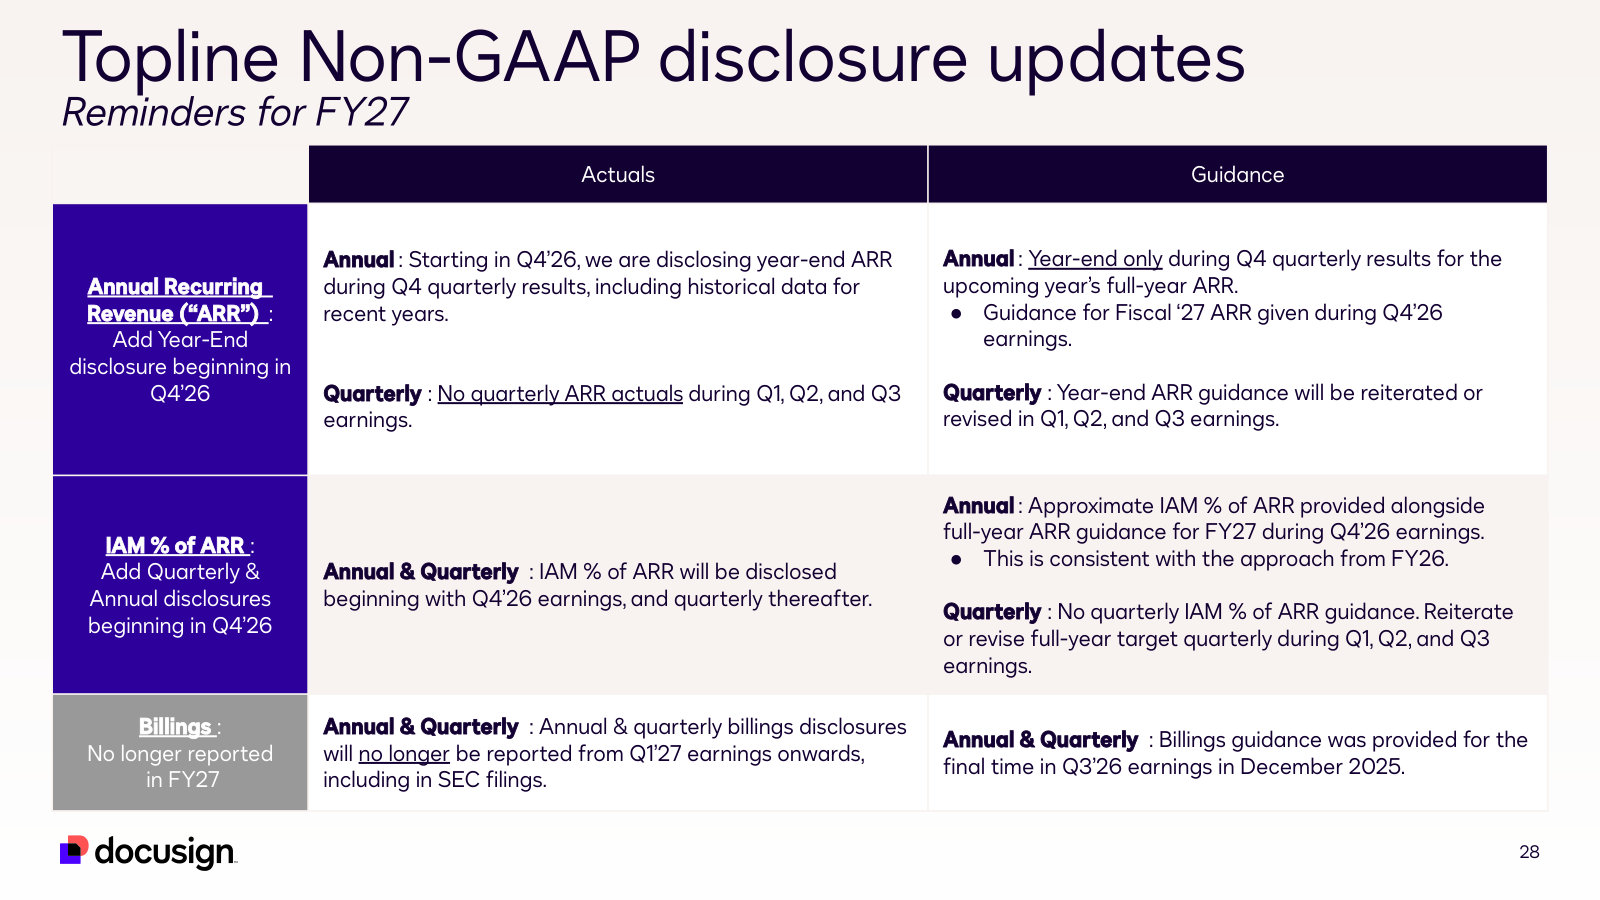
Blake Grayson (CFO): This quarter, we are previewing 3 future disclosure updates that will take effect in our Q4 2026 earnings call in March. These updates reflect investor feedback, and our primary goals are to provide better transparency in measuring both our long-term growth rate and IAM's role as a growth driver, as well as to focus on the underlying dynamics of growth in our business rather than those affected by timing. Please see Slide 28 in our Q3 earnings deck for a full summary of the changes. First, at the end of every fiscal year, starting this Q4 2026, we will disclose annual recurring revenue, or ARR, including historical data for recent years. We will also provide full-year ARR growth guidance for fiscal 2027, which we will update quarterly during our first, second, and third quarters. Second, we will also introduce IAM as a percentage of ARR as a quarterly reporting metric beginning in Q4 of 2026. Consistent with the approach in fiscal 2026, we will also provide guidance in fiscal 2027 for the approximate year-end IAM percentage of ARR to create greater transparency into IAM's anticipated contribution to total growth. Finally, as previously discussed, we will no longer report billings in fiscal 2027. This quarter will be the last quarter we provide billings guidance, and Q4 of 2026 will be the last quarter we report non-GAAP billings and reconciliations in earnings materials and SEC filings. We believe replacing billings as a reporting metric with ARR metrics will improve investor understanding of how DocuSign is managing its long-term growth trajectory and minimize quarter-to-quarter timing volatility in our reporting. One question we anticipate is why not report ARR on a quarterly basis? The reason is that our quarterly net new ARR, as it is relatively small compared to our book of business, is subject to timing volatility similar or even more pronounced than quarterly billings and can be highly volatile on a year-over-year basis. For example, in fiscal 2026, we are forecasting to add approximately $240 million in net new subscription revenue or around $60 million on average per quarter. With that small of an absolute figure, slight timing fluctuations on deals can have large growth rate impacts. Similar to billings, these timing fluctuations can detract from the insight that ARR provides along with our aspiration to focus on accelerating our long-term growth. Our goal through providing annual ARR guidance, updated each quarter, along with quarterly IAM disclosures, is to provide a full transparent picture of that growth.
p. 3 · Read in context →
First IAM renewal cohorts: renewing above the eSignature base, with expansion skewed to larger customers.
Jacob Roberge (William Blair); Allan Thygesen (CEO): Could you talk more about what you're seeing with the early renewal cohorts? It sounds like retention has been strong. But for customers that may have initially started with only a portion of their base on IAM, are you starting to see those customers shift to broader and wider IAM deployments on renewal? […] Yes. Overall, we're happy with the early results. We launched IAM in June of last year for commercial customers in North America and Australia. These are the cohorts that are renewing now, and we expanded internationally into the enterprise sector toward the end of last year. The early indicators are very positive. They renew at higher rates than our traditional signed business. We will monitor this closely. Regarding expansion, I don't have additional details at this time, but you will see it reflected in our future projections for ARR. We are optimistic that IAM will continue to grow steadily within companies over time. Smaller companies have less expansion potential, but with larger companies, when deployed in individual departments or divisions, the opportunities for expansion are greater. Overall, we feel very good about both the initial sale and the adoption and follow-up.
p. 6 · Read in context →
Q1 Fiscal Year 2026 Earnings Call — Q1 FY2026
The quarter the transformation cost them: a billings miss caused by their own sales-comp change, and the clearest explanation on record of how renewal timing distorts the reported metrics. · Open the full transcript →
The miss disclosed in the opening minutes, with the company's own framing: timing, not demand.
Allan C. Thygesen (CEO): As discussed last quarter, in Q1, we made several foundational go-to-market changes to realize IAM's potential. Our full year guidance anticipated that these changes would lead to lower early renewal billings in fiscal '26 after Q1. Instead, the impact happened sooner than anticipated, resulting in lower Q1 early renewals. As a result, billings growth ended slightly below our guidance range of 4% year-on-year, an outcome of timing, not demand.
p. 1 · Read in context →
What changed in the sales model — segments, territories, comp — and management accepting the forecasting error.
Allan C. Thygesen (CEO): Efficiency gains from our rapidly improving self-service channel enabled us to make broader go-to-market changes in Q1, all with the intention of maximizing IAM's long-term potential. We migrated a meaningful cohort of customers to the self-serve first digital experience, freeing up our sales team to concentrate on higher-value prospects with greater revenue potential. Sales force changes included rolling out new customer size segments, territories, and performance-based compensation. We're using our investment dollars judiciously. And in fiscal '26, we invested in greater sales capacity without expanding our team. Our initial annual guidance expected a lower rate of early renewals in fiscal '26 as reps increasingly focus on IAM expansion potential. We anticipated the impact to take place after Q1, but the reduction in early renewals began sooner than forecasted. This resulted in lower-than-expected early renewal billings in Q1. We take responsibility for not fully anticipating the timing of the shift in our guidance.
p. 3 · Read in context →
What a healthy renewal means here: fewer flat and partial-churn early renewals, down roughly 30% year over year.
Michael James Turrin (Wells Fargo); Blake Jeffrey Grayson (CFO): you mentioned the health of early renewals in Q1 improved. Can you unpack that piece a bit more? What were you seeing last year? Was that customers renewing smaller in certain instances and as IAM something that you now have in response? Or what else are you doing to continue to improve the health of those renewals going forward? […] From the changes we made to our go-to-market strategy, we've learned that renewals can vary; they can either expand, remain flat, or occur early with some partial churn. For flat renewals or those with partial churn, we typically prefer to renew them during their natural renewal cycle, often referred to as their on-time contract date. There are various reasons why customers may choose a flat renewal with high capacity or consumption; they may not want to expand but still need to renew. The significant takeaway from the data I shared earlier is that the proportion of flat and partial churn renewals decreased by 30% year-over-year. This indicates that our approach is working as intended, with a shift towards early renewals with expansion rather than those that experience partial churn. We recognize that not every customer will expand their commitment upon renewal, which is why I emphasize that the overall health of our renewals is strengthened by focusing on those flat renewals with expansion, as they are crucial for advancing the business.
p. 14 · Read in context →
The metric change foreshadowed two quarters early: billings called not ideal, with ARR already under discussion.
Michael James Turrin (Wells Fargo); Blake Jeffrey Grayson (CFO): So did you consider ARR as a substitute for billings at all? Or what from your perspective makes billings the right metric to focus us all in on given some of the puts and takes and questions you're feeling here? […] Yes. No, it's a great question, and it's something that we talk about a lot. Billings is clearly not ideal because of the impact of timing, right? In this quarter and the past couple of quarters, actually, the way we handle that is we try to be really clear about that. So when it's a tailwind and it provides kind of that extra growth for us, we are trying to be very clear and transparent with folks about that. And I think we did a good job of that in the second half of last year where we had that tailwind, and we're sure to highlight it. It's also part of the reason why we're talking about IAM as a percentage of recurring revenue and book of business and not billings.
p. 14 · Read in context →
Q1 Fiscal Year 2025 Earnings Call — Q1 FY2025
The landmark call where the current strategy was introduced: what IAM is, how it differs from CLM, how it would be priced, and how long management said it would take to matter. · Open the full transcript →
The original definition of IAM: eSignature and CLM plus Maestro, Navigator and App Center, and the problem claimed.
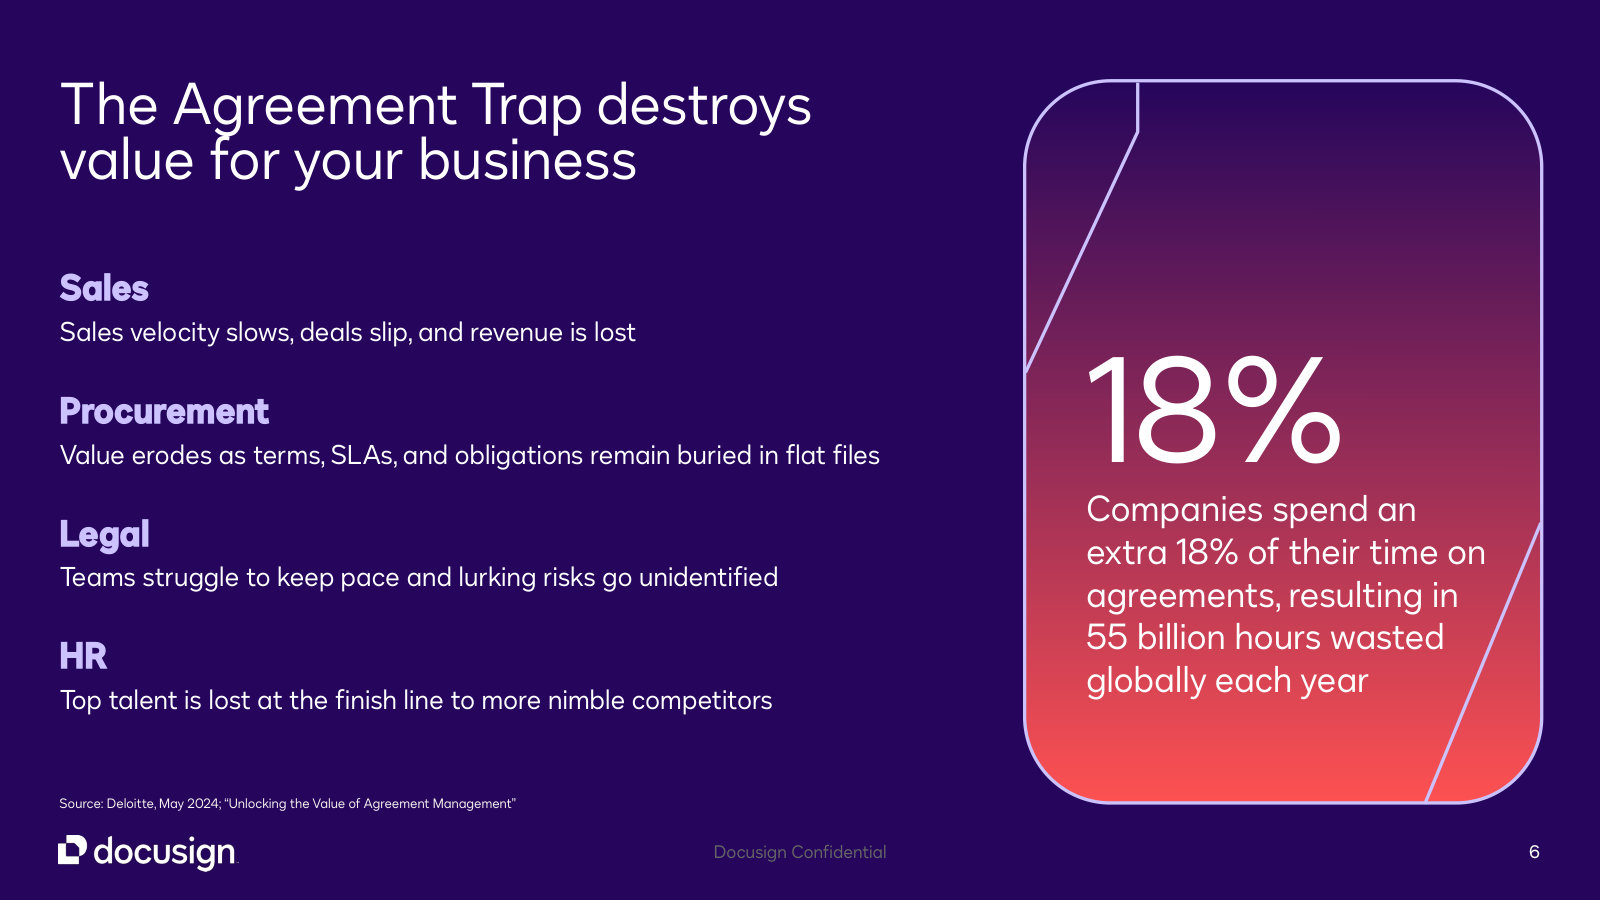
Allan Thygesen (CEO): Companies experience universal friction and frustration in managing agreements, and the costs add up. According to a recent study by Deloitte, poor agreement management systems and practices cost nearly $2 trillion in global economic value annually and cost workers billions of hours in lost time. […] The DocuSign IAM platform is a significant departure from our past approach of only offering standalone products. The platform combines our current products, including our market-leading esignature and CLM products with new platform services that customers have asked for, including DocuSign Maestro, our new agreement workflow builder to automate the creation of agreements without using code. With Maestro, customers can configure custom agreement workflows in minutes, combining DocuSign capabilities like eSignature, ID verification, and data verification with third-party apps to connect to their business processes. Second, DocuSign Navigator, largely to store, manage, and analyze a customer's entire library of accumulated agreements. This includes past agreements signed using DocuSign eSignature, as well as non-DocuSign agreements. Navigator leverages AI to transform unstructured agreements into structured data, making it easy to find agreements, quickly access vital information, and gain valuable insights from agreements. Third, DocuSign App Center, to help customers easily integrate third-party applications into their agreement workflows without any coding or expensive custom development. This is particularly powerful for DocuSign Admins and Process Builders, who can easily configure IAM for their unique agreement management needs.
p. 2 · Read in context →
Why IAM was deliberately built lighter than CLM, and the admission that it is a harder, longer sale.
Patrick Walravens (JMP Securities); Allan Thygesen (CEO): So the launch of the IAM platform is super exciting, but it does make me wonder what are you guys going to do in terms of creating a repeatable go-to-market motion, and how are you going to sell this in a consistent manner given the way it's rolling out and the old products versus the new ones? […] First of all, we designed IAM to be very broadly applicable. Historically, in the broader contract management space and specifically CLM, it was mainly accessible to large enterprises that could afford the necessary customization and integration. IAM is more lightweight and can be deployed by a wider range of companies and users. This also means it offers a natural upsell and cross-sell opportunity to our signature product, which has a broader distribution than our CLM product. I don't want to downplay that this represents an evolution in terms of scale, the number of stakeholders, and the complexity of the sales process. However, we're leveraging our entire eSignature business, which is exciting, and we are already starting to close some deals. We just made it available through channels a week ago, so I'm cautious not to draw too many conclusions from that yet. Nevertheless, I feel confident about our ability to establish a repeatable process starting in the commercial space and then progressing to our enterprise customers. We're currently seeing a significant amount of inbound interest on the platform.
p. 8 · Read in context →
The monetization thesis at launch: seat-based pricing at a premium, betting customers will share the value created.
Josh Baer (Morgan Stanley); Allan Thygesen (CEO); Blake Grayson (CFO): I'm curious about what capabilities are lacking or need to be introduced to better serve the broader enterprise market. Also, coul you provide some insights into the economic effects as customers start adopting IAM? […] Regarding our pricing structure, our core eSignature product has traditionally been sold based on envelope capacity, meaning customers purchase a specific number of envelopes. We also provide seat configurations, and CLM has mainly been sold on a seat basis. We are transitioning IAM to be mainly sold on a seat basis with adjustments for different user profiles and additional charges for premium features. We are managing this evolution carefully to ensure that customers who only need our basic eSignature product can still purchase it in a familiar way. At the same time, customers who wish to utilize IAM and the extensive features we have introduced can do so, albeit at a premium compared to our previous packages. This is our approach to addressing these needs. […] Our overall philosophy as we think about IAM is that if we can create more value for customers, and we believe pretty strongly IAM is going to do just that, customers will agree to share in some of that value with us. And it can come in a number of different ways, right? It can come from perhaps expansion as we become more integral to a customer and their workflows and their processes, or it can also become a stickier relationship, right, where we can drive better retention trends as well.
p. 9 · Read in context →
Expectation-setting on day one: against a roughly $3 billion book of billings, IAM would take years to move the needle.
Blake Grayson (CFO); Allan Thygesen (CEO): Yeah. I think we'll see some lift next year, but we're not ready yet to talk about the exact magnitude. But yes, that would be a reasonable expectation. […] I want to highlight that we just launched this for general availability about a week ago, so it will take time to ramp up. We also need to consider the overall size of our business and the renewal cycles involved. Our full-year guidance is around $3 billion in billings, so moving that needle is going to require some time. I'm mostly excited about getting the launch out and ensuring a positive customer experience, while also encouraging the team to iterate on these aspects. In the early stages of a new product launch, this focus, along with the goto-market strategy, is crucial. If we get these elements right, we’ll be able to generate momentum in billings moving forward.
p. 10 · Read in context →
More calls
Q2 Fiscal Year 2026 Earnings Call — Q2 FY2026 · 13 pages · The quarter after the stumble: revenue up 9% and billings up 13%, and management's account of whether the Q1 go-to-market changes actually worked. · Open →
Q4 and Fiscal Year 2025 Earnings Call — Q4 FY2025 · 17 pages · Where the fiscal 2026 plan was set: the one-point early-renewal billings headwind that later blew up, the rule that reps cannot sell IAM without an uplift, and why revenue lags billings by six to seven quarters. · Open →
Q3 Fiscal Year 2025 Earnings Call — Q3 FY2025 · 13 pages · IAM's first quarters in market ahead of the international and enterprise launch, with dollar net retention back to 100% from the 98% trough. · Open →
Q2 Fiscal Year 2025 Earnings Call — Q2 FY2025 · 13 pages · Analysts push on why dollar net retention stays stuck at 99% through the pandemic renewal cohorts — the retention debate that preceded the IAM ramp. · Open →
Q4 and Fiscal Year 2024 Earnings Call — Q4 FY2024 · 9 pages · The efficiency reset: the February 2024 restructuring of roughly 400 employees, about 6% of the base, and how much of the savings management chose to keep rather than reinvest. · Open →
Q1 Fiscal Year 2024 Earnings Call — Q1 FY2024 · 14 pages · The pre-IAM baseline against which the transformation should be judged: dollar net retention at 105% and still falling, with a different CFO at the table. · Open →
Q1 Fiscal Year 2023 Earnings Call — Q1 FY2023 · 18 pages · The last quarter under founder-era management, with revenue growing 25% and dollar net retention at 114% — the starting point for everything that followed. · Open →
DocuSign, Inc.'s annual reports contain management's most considered account of the business. These are the sections, passages and visual pages worth opening in the originals preserved in Sources.
Docusign, Inc. — FY2026 Annual Report (Form 10-K) — FY2026 (year ended January 31, 2026)
The latest 10-K: an 8%-growth e-signature franchise becoming an IAM platform, with IAM still 10.8% of ARR. · Open the full document →
Item 1. Business — Overview — p. 5 · Read the full section →
Management's own definition: a 98%-subscription franchise where IAM is the stated future but eSignature is still the engine.
The pricing model shifting from Envelope volume to user-based IAM tiers.
Historically, we offered access to most of our products on a subscription basis with prices based on the functionality and the quantity of Envelopes required by our customers. Similar to the physical envelopes historically used to mail paper documents, an Envelope is a digital container used to send one or more documents for signature or approval to one or more recipients. […] Our IAM subscription offerings have multiple pricing tiers as well as specialized packages for specific user personas, customer verticals and segments, and departments within an organization. While IAM subscriptions include our core products and solutions, like eSignature, we expect standalone eSignature to continue to represent the majority of our revenue for the foreseeable future given IAM’s early growth phase.
p. 5 · Read in context →
Item 1. Business — Our Growth and Investment Strategy — p. 7 · Read the full section →
The three pillars management is spending against: product innovation, omnichannel go-to-market, and operating efficiency.
Pillar one: R&D spend to turn IAM into a platform business.
We believe that our market opportunity is large, and we plan to invest to support long-term growth based on the three pillars of our long-term strategy: […] The first pillar is to accelerate product innovation through research and development investments, helping our IAM platform address our customers’ agreement management needs comprehensively. We aim to deliver category-leading value in the agreement management market while evolving into a platform company.
p. 7 · Read in context →
Pillars two and three: omnichannel GTM, efficiency, and the 13% international growth rate.
The second growth pillar focuses on improving our omnichannel go-to-market (“GTM”) capabilities to better meet the evolving needs of our customers. By strengthening our direct sales, partner, and self-service routes to market, we aim to simultaneously accelerate our ability to scale while reducing our customer acquisition and management costs. […] Finally, our third growth pillar is to enhance operational and financial efficiency to scale effectively and sustainably. This includes prioritizing investments in infrastructure and technology that best serve our diverse customer base, including our migration to cloud-based infrastructure. Additionally, we continue to evaluate strategic acquisitions and partnerships that align with our growth objectives and expand our product offerings. […] International revenue increased by 13% in the year ended January 31, 2026, compared to the year ended January 31, 2025.
p. 9 · Read in context →
Item 1A. Risk Factors — Business and Industry Risks — p. 23 · Read the full section →
Two company-specific risks: one product carries the revenue, and AI is making its core capability cheap to replicate.
Single-product concentration: eSignature is "the substantial majority" of revenue and demand has already fluctuated.
We derive a majority of our revenue from our eSignature product, and slower or declining adoption or sales of our eSignature product, without corresponding adoption or sales of our other products and solutions in our IAM platform, could cause our operating results to suffer. […] Sales of subscriptions to our eSignature product account for the substantial majority of our subscription and professional services revenue. Although we continue to add to our suite of other products and solutions in our IAM platform for automating the agreement process, we expect that we will be substantially dependent on our eSignature product to generate revenue for the foreseeable future. […] We have experienced, and may continue to experience, declines and fluctuations in the demand for our eSignature product due to a number of factors, including changing patterns of customer adoption and retention, shifts in customer spending levels, a highly competitive market, and general economic and global market conditions.
p. 23 · Read in context →
Item 1A. Risk Factors — Financial Risks, including Taxation — p. 43 · Read the full section →
Why reported revenue lags the business: long sales cycles feeding a ratable model that delays both downturns and inflections.
Item 7. MD&A — Executive Overview of Fiscal 2026 Results — p. 75 · Read the full section →
Management's framing of the year, plus a customer-count disclosure they will redefine on an ARR basis in fiscal 2027.
Customer base by segment — and notice that the definition changes next year.
As of January 31, 2026, we had a total of over 1.8 million customers, including approximately 280,000 small and medium-sized businesses (“SMBs”), mid-market companies, and large enterprise customers served by our direct sales force. We had a total of nearly 1.7 million customers, including over 260,000 customers served by our direct sales force as of January 31, 2025. […] In fiscal 2027, we plan to distinguish between enterprise, commercial mid-market and SMB customers on the basis of annual recurring revenue.
p. 76 · Read in context →
Item 7. MD&A — Discussion of Results of Operations — p. 82 · Read the full section →
The year in one table: 8% revenue growth, flat 79% gross margin, operating margin to 9% on restrained sales and marketing.
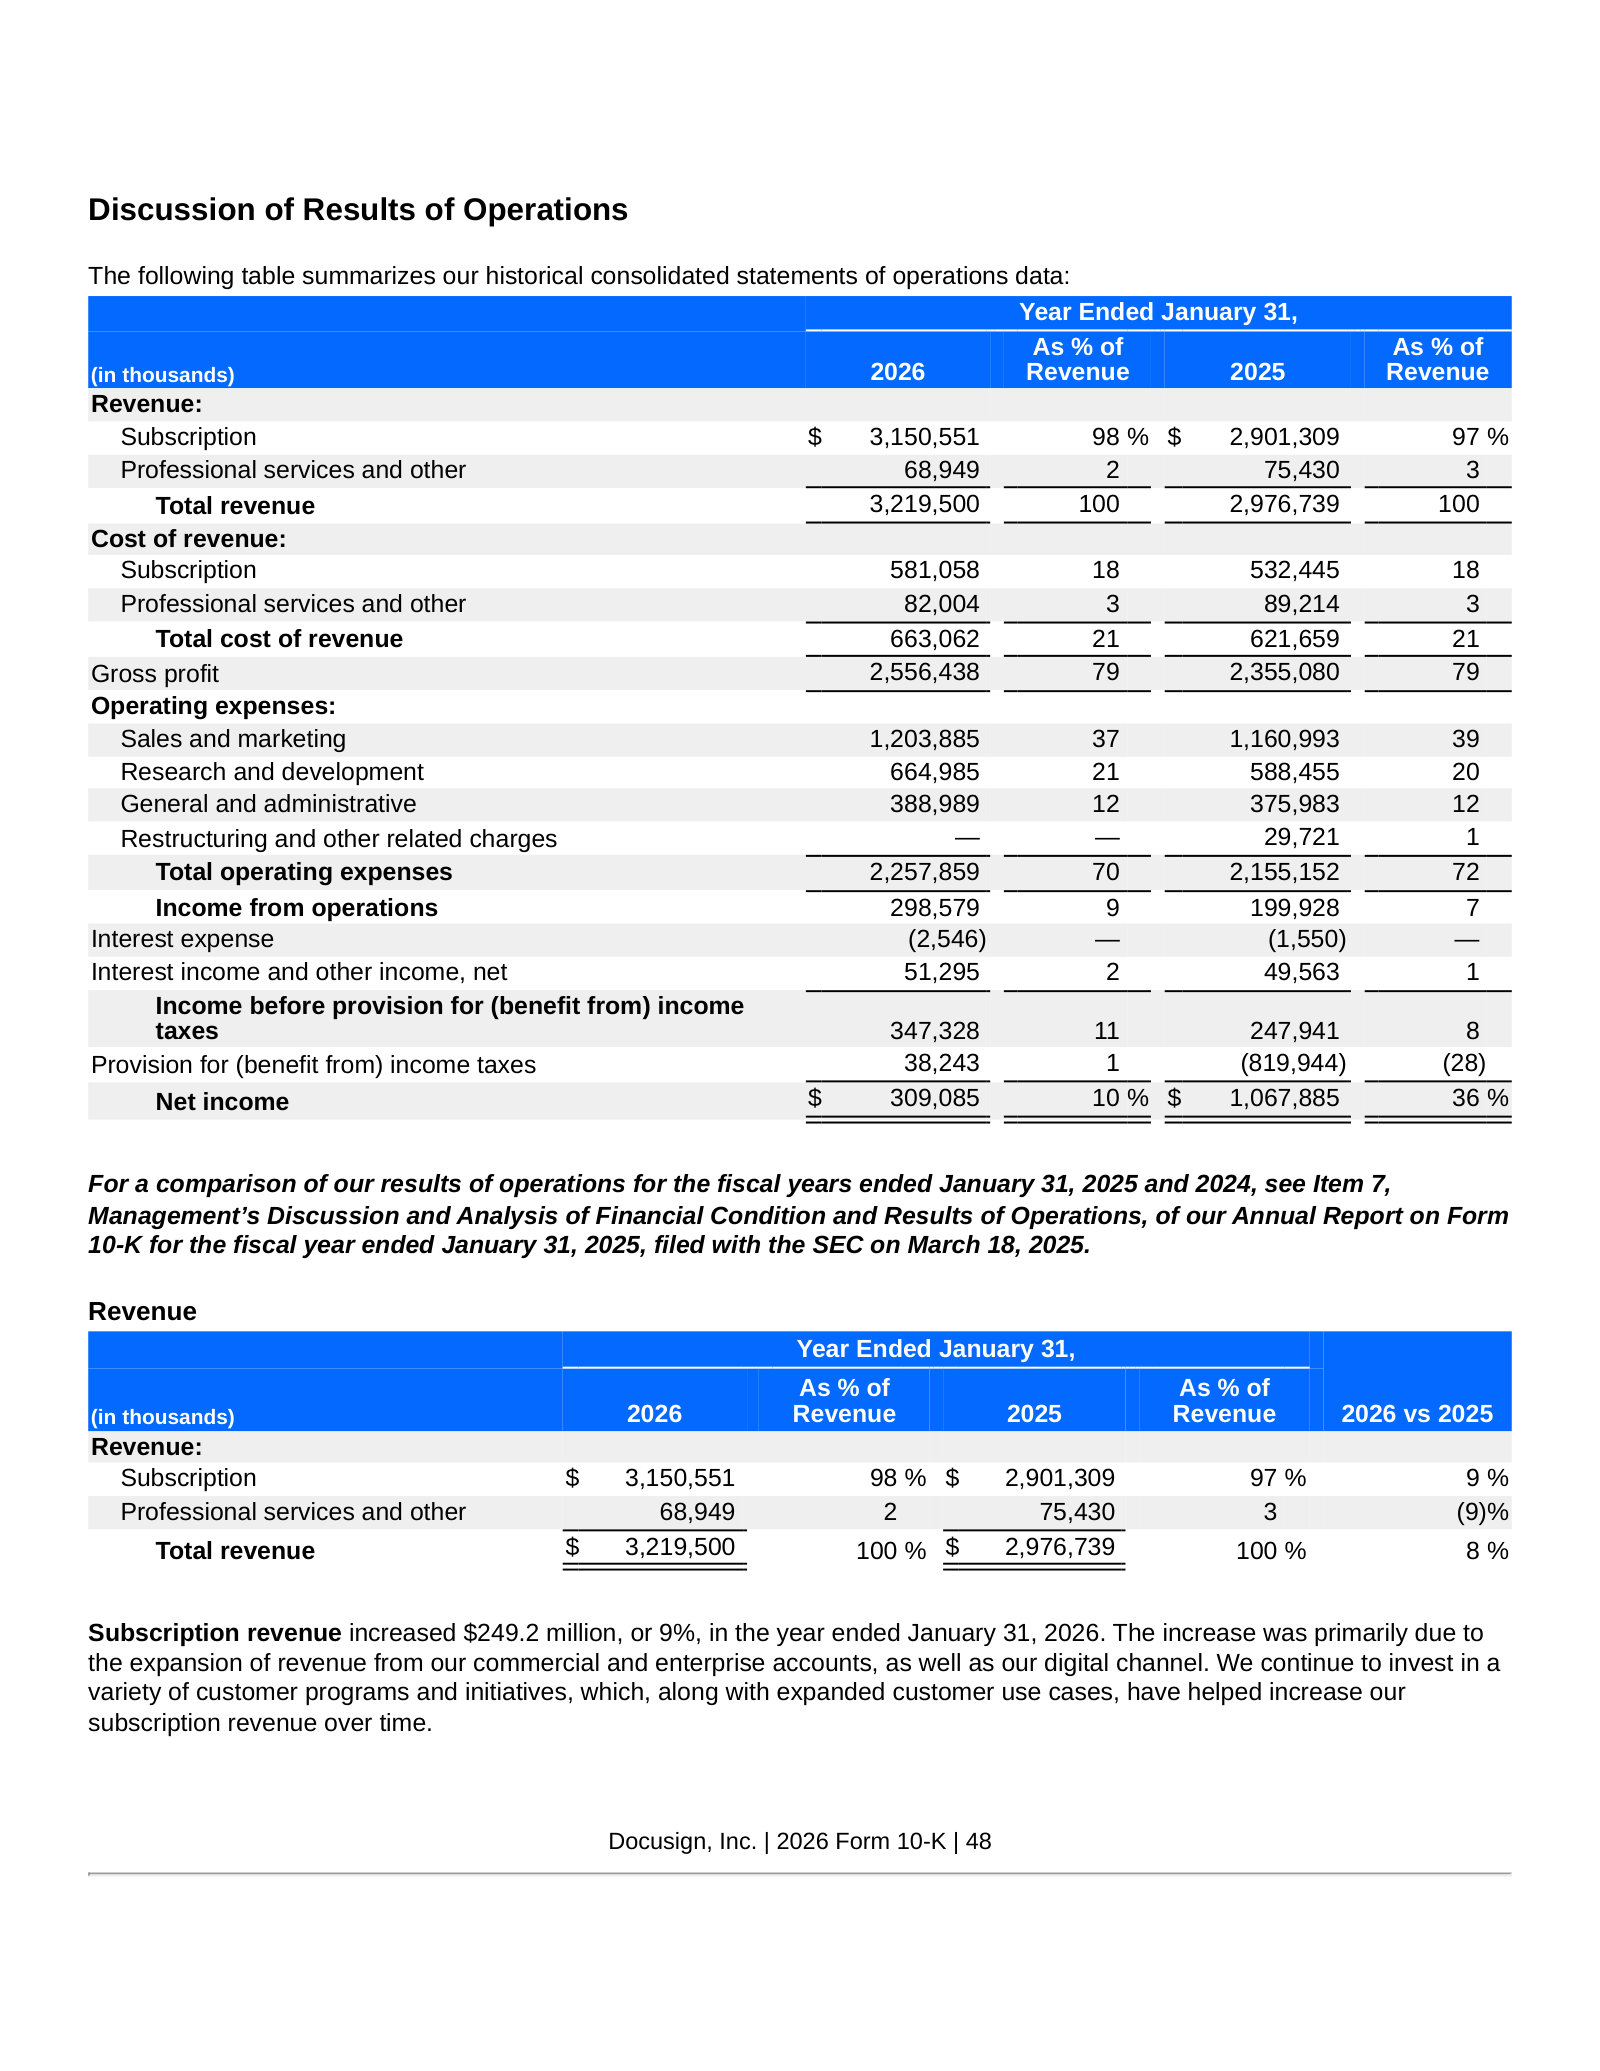
The spending mix: sales and marketing up 4%, R&D up 13%.
Sales and marketing expenses increased $42.9 million, or 4%, in the year ended January 31, 2026, primarily due to investments in our workforce. […] Research and development expenses increased $76.5 million, or 13%, in the year ended January 31, 2026, primarily due to investments in our workforce to support product innovation, including expansion due to our acquisition of Lexion in fiscal 2025.
p. 83 · Read in context →
Item 7. MD&A — Critical Accounting Policies and Estimates — p. 88 · Read the full section →
The estimate that defines subscription economics: how long commissions are capitalized, set by judgments on customer life.
Deferred contract acquisition costs — amortization period driven by estimated customer life.
The critical accounting estimates, assumptions and judgments that we believe to have the most significant impact on our consolidated financial statements are revenue recognition, deferred contract acquisition costs, stock-based compensation, income taxes, loss contingencies, and valuation of acquired intangible assets in business combinations. […] Contract acquisition costs are amortized on a straight-line basis over their period of benefit. […] The period of benefit for commissions paid for the acquisition of the initial subscription contract is determined by considering our customer life and the technological life of our software platform and related significant features. The period of benefit for commissions on renewal subscription contracts is determined by considering the weighted average contractual term for our renewal contracts. […] Any future changes in circumstances around our customer life and weighted average contractual terms of renewal contracts may materially change the periods of benefit and therefore the amortization amounts recognized in our consolidated statement of operations and comprehensive income.
p. 88 · Read in context →
Item 7. MD&A — Non-GAAP Financial Measures and Other Key Metrics — p. 92 · Read the full section →
Where ARR and the GAAP-to-non-GAAP gap are defined — and where management retires billings after the first quarter of FY2027.
ARR of $3,272M and IAM's share of it: 10.8% versus 2.3% a year earlier.
ARR was $3,272 million as of January 31, 2026, $3,030 million as of January 31, 2025, and $2,805 million as of January 31, 2024. As of January 31, 2026, IAM represented 10.8% of our total ARR as of January 31, 2026, and 2.3% of our total ARR as of January 31, 2025.
p. 94 · Read in context →
DocuSign, Inc. — FY2024 Annual Report (Form 10-K) — FY2024 (year ended January 31, 2024)
The last 10-K before the April 2024 IAM launch — included as the before-picture of the strategy. · Open the full document →
Item 1. Business — Overview — p. 5 · Read the full section →
How the company described itself pre-IAM, including a $50 billion market claim the FY2026 filing no longer makes.
The pre-IAM framing, 1.5 million customers, and the $50 billion market estimate.
DocuSign offers products that address agreement workflows and digital transformation as part of its agreement management platform, enabling agreements to be signed electronically on a wide variety of devices, from virtually anywhere in the world, securely. […] As of January 31, 2024, over 1.5 million customers and more than a billion users in over 180 countries use our products and solutions to accelerate and simplify the process of doing business. […] The global reach and broad applicability of eSignature across business functions, combined with our offering of end-to-end contract lifecycle management applications represents an addressable market of approximately $50 billion, according to our estimates.
p. 5 · Read in context →
More annual reports
Docusign, Inc. — FY2025 Annual Report (Form 10-K) — FY2025 (year ended January 31, 2025) · 158 pages · First 10-K describing IAM as the platform strategy; also the $837.3 million valuation-allowance release year. · Open →
DocuSign, Inc. — FY2023 Annual Report (Form 10-K) — FY2023 (year ended January 31, 2023) · 162 pages · The post-pandemic reset edition: growth decelerating sharply, new leadership, and the first restructuring plan. · Open →
DocuSign, Inc. — FY2022 Annual Report (Form 10-K) — FY2022 (year ended January 31, 2022) · 166 pages · Peak COVID-era edition, when the business was framed as the DocuSign Agreement Cloud and growth ran above 40%. · Open →
Source: S&P Capital IQ consensus via Xpressfeed · Generated 2026-07-24.
DocuSign's consensus has been marked up on the earnings line and left alone on the top line: FY2028 normalized EPS sits 12% above where it was 180 days ago while FY2028 revenue is up under 2%. The company has beaten both revenue and normalized EPS in all eight quarters the record covers, with the last five EPS beats between 6.4% and 10.5%. Analysts agree on FY2027 revenue to within 1% top to bottom, then split on profit: the FY2027 EBITDA range runs 1177 to 1552 on seven estimates. Despite the upgrades and the beat streak, 16 of 22 recommendations are holds.
FY2028 EPS consensus is 12% higher than six months ago; revenue is up under 2%
FY2027 shows the same shape — EPS up about 10% over 180 days against revenue up under 2%. The move is concentrated in the 90-to-180-day window; all four series are unchanged over the last 30 days.
Currency: USD · Scale: money in millions, absolute · Point-in-time consensus; Δ90d is Now versus 90d.
| Metric | FY | 180d | 90d | 30d | Now | Δ90d |
|---|---|---|---|---|---|---|
| EPS (normalized) | FY2027 | $4.11 | $4.43 | $4.53 | $4.53 | +2.2% |
| EPS (normalized) | FY2028 | $4.54 | $5.03 | $5.10 | $5.10 | +1.3% |
| Revenue | FY2027 | $3.43bn | $3.49bn | $3.50bn | $3.50bn | +0.2% |
| Revenue | FY2028 | $3.70bn | $3.75bn | $3.76bn | $3.76bn | +0.2% |
Eight for eight: every quarter on record beat both revenue and EPS consensus
EPS surprises run 0.7% to 20.4% and revenue surprises 0.7% to 2.6%, a spread that reads as conservatively set guidance rather than genuine upside. The revenue beat has narrowed to 1.0% and 0.7% in the two most recent prints, the two smallest in the record.
Current sequences by metric: Revenue: 8 consecutive beats; EPS (normalized): 8 consecutive beats.
Currency: USD · Scale: money in millions, absolute · Consensus is captured before each actual first became effective.
| Quarter | Metric | Consensus | Actual | Surprise | Outcome |
|---|---|---|---|---|---|
| Q1 FY2027 | Revenue | $824.75m | $830.24m | +0.7% | Beat |
| Q1 FY2027 | EPS (normalized) | $0.99 | $1.09 | +9.7% | Beat |
| Q4 FY2026 | Revenue | $828.22m | $836.86m | +1.0% | Beat |
| Q4 FY2026 | EPS (normalized) | $0.95 | $1.01 | +6.4% | Beat |
| Q3 FY2026 | Revenue | $807.42m | $818.35m | +1.4% | Beat |
| Q3 FY2026 | EPS (normalized) | $0.91 | $1.01 | +10.4% | Beat |
| Q2 FY2026 | Revenue | $780.59m | $800.64m | +2.6% | Beat |
| Q2 FY2026 | EPS (normalized) | $0.85 | $0.92 | +8.6% | Beat |
| Q1 FY2026 | Revenue | $748.92m | $763.65m | +2.0% | Beat |
| Q1 FY2026 | EPS (normalized) | $0.81 | $0.90 | +10.5% | Beat |
| Q4 FY2025 | Revenue | $761.64m | $776.25m | +1.9% | Beat |
| Q4 FY2025 | EPS (normalized) | $0.85 | $0.86 | +0.7% | Beat |
| Q3 FY2025 | Revenue | $745.33m | $754.82m | +1.3% | Beat |
| Q3 FY2025 | EPS (normalized) | $0.87 | $0.90 | +3.0% | Beat |
| Q2 FY2025 | Revenue | $727.84m | $736.03m | +1.1% | Beat |
| Q2 FY2025 | EPS (normalized) | $0.81 | $0.97 | +20.4% | Beat |
Profit lines compound faster than revenue in every forecast year
Normalized EPS outgrows normalized net income in FY2027 and FY2028, so per-share growth is running ahead of profit growth. Gross margin barely moves across the forecast, which places the expansion below the gross line.
Currency: USD · Scale: money in millions, absolute · YoY uses the prior fiscal year from the feed; analyst count and range use the first displayed period.
| Metric | FY2026A | FY2027E | FY2028E | FY2029E | YoY | Analysts | Low / high |
|---|---|---|---|---|---|---|---|
| Revenue | $3.21bn | $3.50bn | $3.76bn | $3.99bn | +7.9% | 22 | $3.21bn / $3.22bn |
| EPS (normalized) | $3.78 | $4.53 | $5.10 | $5.61 | +6.6% | 23 | $3.67 / $3.85 |
| Net income (normalized) | $794.04m | $874.73m | $956.64m | $1.05bn | +6.8% | — | — |
| EBIT | $956.84m | $1.08bn | $1.18bn | $1.31bn | +9.2% | — | — |
| Free cash flow | $989.93m | $1.13bn | $1.23bn | $1.33bn | +15.9% | — | — |
The street agrees on revenue and disagrees on what falls through to profit
The argument is about conversion, not demand. Profit-line coverage is roughly a third of the revenue count, and both thin further in FY2029.
Currency: USD · Scale: money in millions, absolute · Spread/mean is absolute high-low divided by absolute mean.
| Metric | Period | Mean | Low–high | Spread/mean | Analysts |
|---|---|---|---|---|---|
| Revenue | FY2027E | $3.50bn | $3.49bn–$3.52bn | 0.8% | 21 |
| EBITDA | FY2027E | $1.28bn | $1.18bn–$1.55bn | 29.2% | 7 |
| Net income (GAAP) | FY2028E | $433.37m | $356.10m–$491.00m | 31.1% | 8 |
| EPS (normalized) | FY2029E | $5.61 | $4.87–$6.16 | 23.0% | 9 |
Street snapshot
Two buys and three outperforms against sixteen holds and one underperform. Targets span 46.89 to 90 across 18 estimates, and the mean of 59.33 sits above the median of 55.
Currency: USD · Scale: money in millions, absolute · Analyst counts shown explicitly.
| Street view | Reading | Analysts |
|---|---|---|
| Recommendation mix | Buy 2, Outperform 3, Hold 16, Underperform 1, Sell 0 | 22 |
| Consensus score | 2.73 | 22 |
| Target price | mean $59.33; median $55.00; high $90.00; low $46.89 | 18 |
Coverage thins sharply in FY2029
FY2029 revenue carries 10 estimates against 21 for FY2028, and FY2029 EBITDA and GAAP net income rest on 4 each. Treat the outer-year shape as a sketch rather than a settled consensus.
Visible Alpha broker models via S&P Xpressfeed · 16 brokers · 400 line items · freshest revision 2026-06-11.
Sixteen brokers carry DocuSign, and their models tell a narrower story than the headline P&L: growth reaccelerates to +8.6% in FY-2027 before easing to +7.4% in FY-2028, and essentially all of the incremental ARR is IAM. Gross margin is modeled flat near 82%, so the profit improvement comes from opex leverage and a shrinking share count rather than mix. The FY-2027 lines are anchored tightly to guidance; FY-2028 is where the models actually disagree.
Growth peaks at +8.6% in FY-2027, then eases to +7.4% in FY-2028 — an arc, not a trend
| Line | FY-2025A | FY-2026A | FY-2027E | FY-2028E | YoY | Brokers |
|---|---|---|---|---|---|---|
| Revenue | — | — | — | — | — | — |
| Total revenue | $2.96bn | $3.21bn | $3.50bn | $3.76bn | +8.9% | 16 |
| Total revenue, YoY(%) | 7.2% | 7.9% | 8.6% | 7.4% | +0.7pt | 16 |
| ARR | — | — | — | — | — | — |
| ARR | $3.11bn | $3.33bn | $3.55bn | $3.83bn | +6.5% | 11 |
| Net new ARR | $164.34m | $211.63m | $277.90m | $278.69m | +31.3% | 11 |
| Customers | — | — | — | — | — | — |
| Number of customers >$300k ACV(#) | 1,093 Number | 1,176 Number | 1,346 Number | 1,473 Number | +14.5% | 4 |
| Enterprise and commercial customers(#) | 261,008 Number | 280,564 Number | 298,054 Number | 316,201 Number | +6.2% | 7 |
| Total customers(#) | 1.64m Number | 1.82m Number | 1.98m Number | 2.14m Number | +9.0% | 7 |
Key drivers
Brokers take IAM from 18.0% of ARR in FY-2027 to 23.8% in FY-2028, so the modeled recovery is a mix shift inside a flat base rather than broad demand. Coverage narrows quickly on the out-year: 9 brokers carry IAM ARR for FY-2027 and only 5 for FY-2028.
| Line | FY-2025A | FY-2026A | FY-2027E | FY-2028E | YoY | Brokers |
|---|---|---|---|---|---|---|
| ARR - IAM | — | — | $639.26m | $912.58m | — | 9 |
| ARR - Net additions - IAM | — | — | $285.91m | $272.78m | — | 8 |
| ARR - IAM % of ARR(%) | — | — | 18.0% | 23.8% | — | 9 |
| Net new ARR | $164.34m | $211.63m | $277.90m | $278.69m | +31.3% | 11 |
| ARR | $3.11bn | $3.33bn | $3.55bn | $3.83bn | +6.5% | 11 |
FY-2027 is anchored to guidance; the FY-2028 IAM ramp is where brokers actually split
| Line | Period | Median | Q1–Q3 | Min–max | Brokers |
|---|---|---|---|---|---|
| ARR - IAM | FY-2028E | $924.45m | $869.22m–$971.83m | $791.31m–$1.01bn | 5 |
| Net new ARR | FY-2028E | $298.21m | $242.38m–$304.94m | $212.61m–$321.31m | 10 |
| Number of customers >$300k ACV(#) | FY-2028E | 1,424 Number | 1,400 Number–1,498 Number | 1,343 Number–1,700 Number | 4 |
| Operating income/(loss) - Operating | FY-2028E | $1.17bn | $1.16bn–$1.19bn | $1.14bn–$1.27bn | 15 |
| Free cash flow | FY-2028E | $1.24bn | $1.23bn–$1.28bn | $1.19bn–$1.35bn | 12 |
Key drivers
| Line | FY-2025A | FY-2026A | FY-2027E | FY-2028E | YoY | Brokers |
|---|---|---|---|---|---|---|
| Margins | — | — | — | — | — | — |
| Gross margin(%) | 82.1% | 81.8% | 81.8% | 82.1% | -0.0pt | 16 |
| Operating margin(%) | 29.6% | 29.8% | 30.8% | 31.3% | +1.0pt | 16 |
| FCF margin(%) | 29.7% | 30.6% | 32.7% | 33.3% | +2.1pt | 15 |
| Rule of 40, Revenue growth + Operating margin(%) | 36.9% | 37.7% | 39.5% | 38.7% | +1.8pt | 16 |
| Cash per share | — | — | — | — | — | — |
| Free cash flow | $879.86m | $981.07m | $1.14bn | $1.25bn | +16.4% | 15 |
| Free cash flow (FCF) per share($) | $4.20 | $4.68 | $5.93 | $6.73 | +26.7% | 15 |
| Shares - Diluted - Operating(M#) | 209.48m Number | 209.61m Number | 192.51m Number | 186.98m Number | -8.2% | 16 |
The segment, geography and retention lines are one or two analysts, not consensus
Net dollar retention is a single broker at 102.5% for FY-2027 and FY-2028, the US/International split is one model throughout, and the enterprise-versus-web revenue split falls to two brokers by FY-2027 — none of these should be read as consensus. ARR is the reverse of the usual pattern: 11 brokers model FY-2027 but only 2 carry FY-2026, so the base beneath the forecast is thinly supported. The P&L and cash lines are well covered and current, with the freshest revisions dated 2026-06-11.
Headline P&L consensus, momentum and beat/miss live in the CapIQ tab.
Source: S&P Capital IQ transcripts via Xpressfeed · latest indexed call 2026-06-04 · generated 2026-07-24.
Latest call digest
DocuSign, Inc., Q1 2027 Earnings Call, Jun 04, 2026 · 2026-06-04T21:00:00
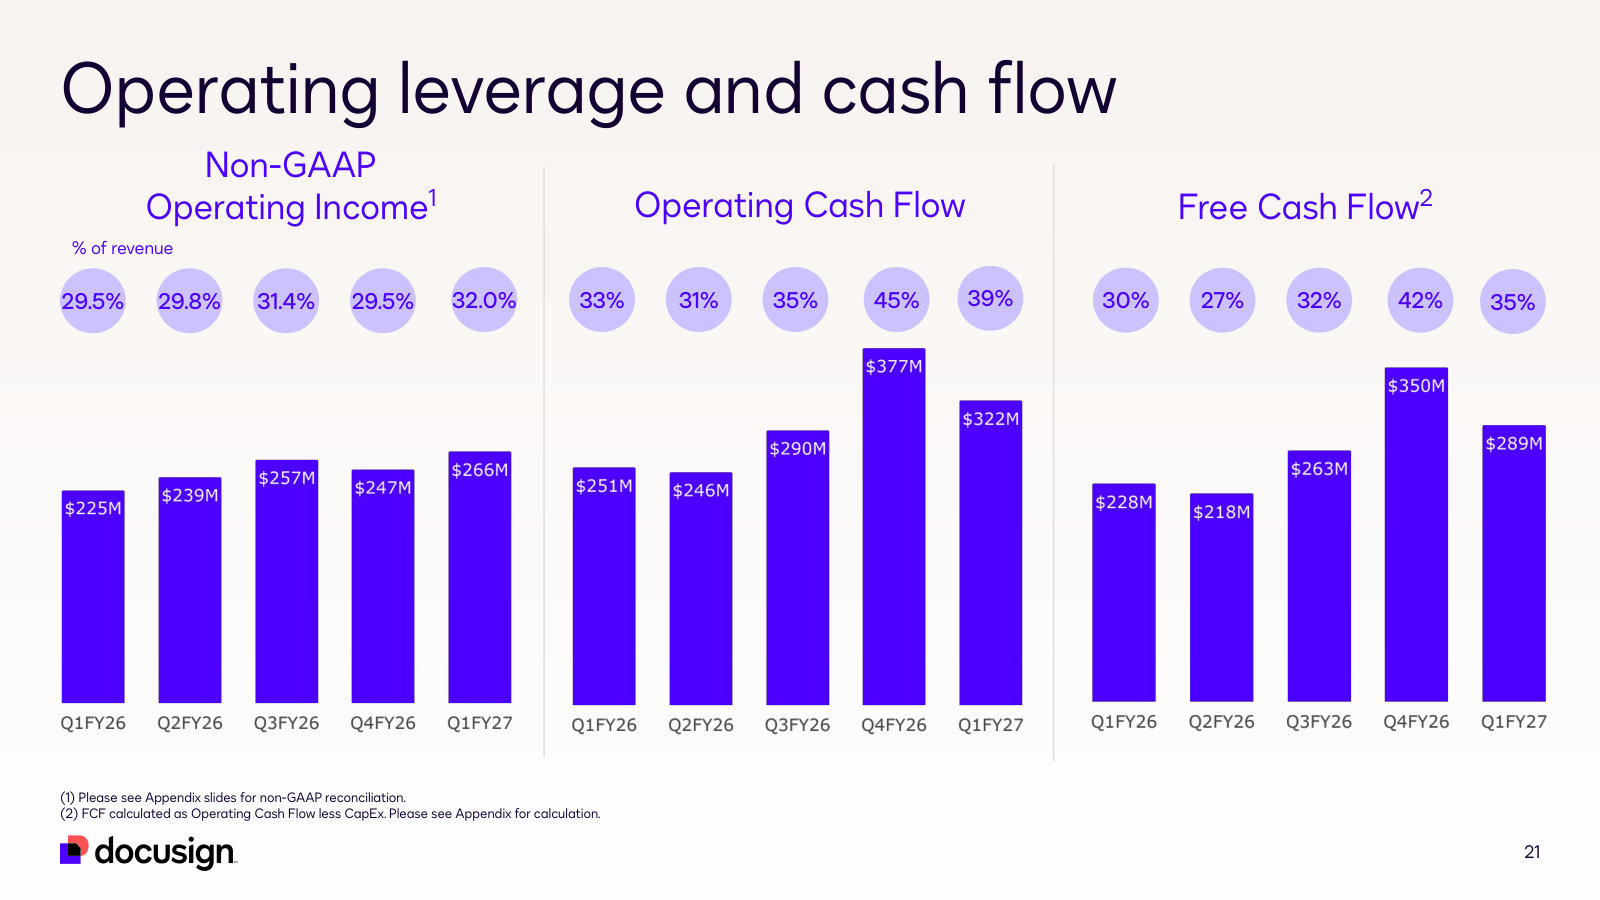
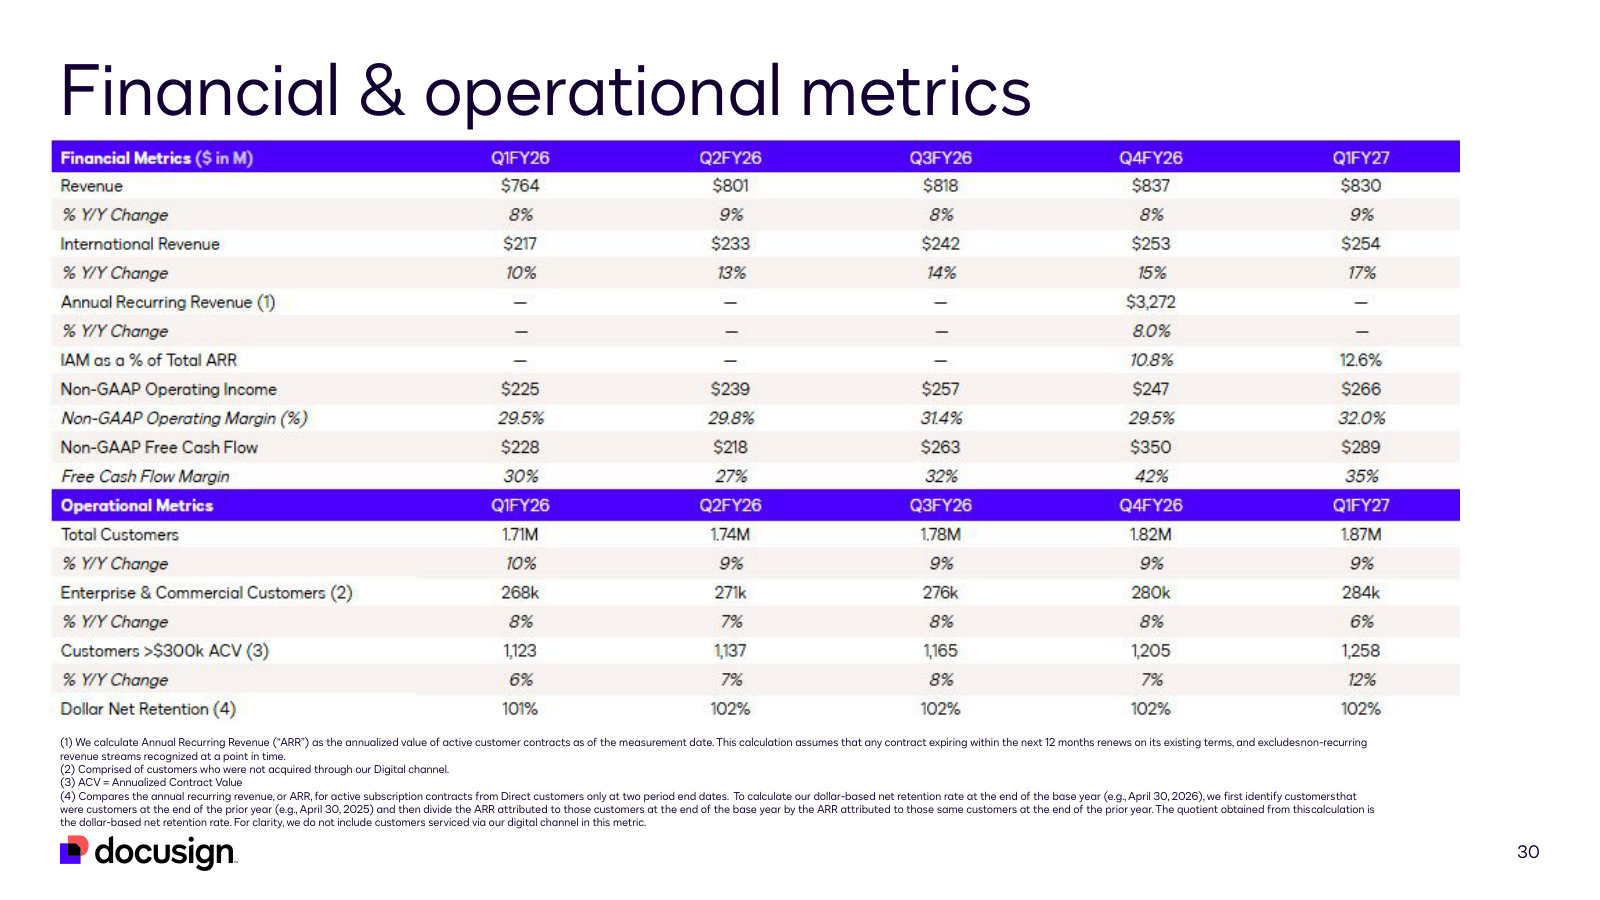
Q1 fiscal 2027, reported June 4, 2026. Prepared remarks were a clean beat-and-hold. Revenue of $830 million grew 9% year-over-year, non-GAAP operating margin reached 32.0% versus a 29.5% comparison, free cash flow was $289 million at a 35% margin, and the company repurchased $318 million of stock — its largest quarterly buyback on record. IAM reached 12.6% of total ARR from 10.8% the prior quarter, with 40,000 companies on the platform. Dollar net retention was over 102%, and customers spending above $300,000 in ACV grew 12% to 1,258, which management called the first double-digit growth in that metric in three years.
Guidance actually stated. The full-year ARR growth range of 8.25% to 8.75% and the roughly 18% IAM share of ARR at year-end were both reiterated unchanged from the Q4 call. Q2 revenue was guided to $865 million to $869 million and fiscal 2027 to $3.490 billion to $3.502 billion. The one raise was profitability: fiscal 2027 operating margin moved to 30.5% to 31.0%, described as an increase of 0.5% at the midpoint versus prior guidance. Gross margin guidance was unchanged and still reflects the tail of the cloud migration.
Where Q&A diverged. Analysts spent less time on the beat than on its size and shape. Rob Owens noted the beat was smaller than historical and that no discrete subscription revenue number was given; Tyler Radke made the same point about subscription revenue and billings looking lighter than normal. Patrick Walravens pressed hardest, saying he would have liked to see double digits by now and that on an FX-adjusted basis growth may have decelerated sequentially — Thygesen replied that no timeline had been set and did not name anything that had proved harder, while Grayson pointed to the prior-year digital add-on comparison. Two separate attempts to get a number on the IAM consumption or ARPC uplift were declined. The company also did not update the ARR guide one quarter into the year, consistent with the philosophy Grayson laid out in March.
Other management points that matter. Enterprise is where the incremental news sat: IAM bookings grew faster year-over-year in North America enterprise than in any other segment, the IAM Platform Plan credit-based pricing model went to general availability in April after a beta, and MCP connections to Anthropic Claude, Gemini and OpenAI ChatGPT were positioned alongside integrations with Coupa, Workday, Greenhouse, Slack and Stripe. Headcount fell sequentially to 6,991, and management declined to guide headcount for the year.
Participant coverage from the latest call.
| Group | Participants | Count |
|---|---|---|
| Management | Operator; Matt Sonefeldt — Head of Investor Relations, DocuSign, Inc.; Allan Thygesen — President, CEO & Director, DocuSign, Inc.; Blake Grayson — Executive VP & CFO, DocuSign, Inc. | 4 |
| Analysts | Robbie Owens — MD & Senior Research Analyst, Piper Sandler & Co., Research Division; Michael Turrin — Equity Analyst, Wells Fargo Securities, LLC, Research Division; Rishi Jaluria — MD & Information Technology Equity Research Analyst, RBC Capital Markets, Research Division; Patrick Walravens — MD, Director of Technology Research & Equity Research Analyst, Citizens JMP Securities, LLC, Research Division; Tyler Radke — VP & Senior Analyst, Citigroup Inc., Research Division; Unknown Analyst; Patrick McIlwee — Research Analyst, William Blair & Company L.L.C., Research Division; Scott Berg — Senior Analyst, Needham & Company, LLC, Research Division; Brent Thill — MD & Tech Sector Equity Analyst, Jefferies LLC, Research Division; Jacob Gideon — Research Analyst, BofA Securities, Research Division; Allan M. Verkhovski — Application Software Analyst, BTIG, LLC, Research Division | 11 |
Curated latest-call exchanges; one row per analyst topic.
| Analyst | Firm | Topic | What changed in Q&A |
|---|---|---|---|
| Patrick Walravens | Citizens JMP Securities, LLC, Research Division | Why growth is not yet double digits; possible FX-adjusted sequential deceleration | The hardest exchange on the call. Thygesen said no timeline had ever been set and described himself as pleased rather than disappointed, without identifying what had been harder than expected. Grayson then argued the apparent deceleration reflects the prior-year digital add-on comparison and FX, and that normalized growth is roughly in line. |
| Robbie Owens | Piper Sandler & Co., Research Division | Size of the beat and the shape of the quarter | Owens observed the beat was smaller than historically and that no discrete subscription revenue figure was provided. Grayson said he had no concerns with where the quarter landed and attributed the narrower beat to more precise forecasting as operational maturity improves. |
| Robbie Owens | Piper Sandler & Co., Research Division | Quantifying the eSignature consumption lift from IAM adoption | Asked twice for a metric. Thygesen called the lift significant and meaningful but declined to disclose a percentage, and said the company does not intend to start disclosing one. |
| Tyler Radke | Citigroup Inc., Research Division | $300,000-plus ACV strength versus lighter subscription revenue and billings | Grayson reminded analysts billings is no longer guided and is volatile on timing, said billings came in as expected, and redirected to the full-year ARR guide as the outlook that matters. |
| Tyler Radke | Citigroup Inc., Research Division | Confidence in the 8.5% ARR guide versus 90 days ago, and linearity of the IAM ramp | Thygesen answered that a full-year ARR guide is effectively a Q4 guide, that visibility builds through the year, and that the guide would be updated as the year progresses. On IAM linearity he called a linear progression a relatively safe assumption but declined to endorse it as a target. |
| Unknown Analyst (Jason, on for Alex Zukin) | Wolfe Research, LLC | Deriving IAM ARPC uplift from disclosed IAM ARR and customer counts | The analyst walked through his own math implying a high single-digit uplift. Grayson pushed back on the framing, arguing IAM is a platform shift rather than a separate product and that per-customer arithmetic is not the right lens, without confirming or correcting the number. |
| Michael Turrin | Wells Fargo Securities, LLC, Research Division | Positioning versus the frontier LLM providers Docusign is partnering with | Thygesen framed the partnerships as an extension of a long-standing API and ISV distribution strategy and cited private consented agreement data, cross-functional workflow breadth and trust as the moat. He said several of the model-provider partnerships originated as inbound inquiries. |
| Patrick McIlwee | William Blair & Company L.L.C., Research Division | Competing against CLM vendors and broader workflow platforms | Thygesen conceded the CLM space has several vendors and is evolving, argued the IAM opportunity is materially wider than CLM, and pointed to partnerships with Harvey, Legora and CoCounsel Legal by Thomson Reuters as coexistence rather than head-to-head competition. |
| Allan M. Verkhovski | BTIG, LLC, Research Division | Direction of net revenue retention on a constant-currency basis | Grayson said FX is not a major mover in the metric, repeated that DNR has improved sequentially for several quarters, and then qualified that on a rounded basis it has been flat for the past few — a more measured framing than the prepared remarks. |
| Brent Thill | Jefferies LLC, Research Division | Whether headcount will be down for the full year | The question was directed to Grayson but answered by Thygesen, who declined to guide headcount, said he would be comfortable with headcount rising slightly, and redirected to operating expense growth relative to revenue. |
Theme tracker
Themes are curator-classified across supplied calls.
| Theme | Status | Quarters mentioned | Read-through |
|---|---|---|---|
| IAM as the designated growth engine | persisted | Q1 2025, Q2 2025, Q3 2025, Q4 2025, Q1 2026, Q2 2026, Q3 2026, Q4 2026, Q1 2027 | Present in every prepared remark since the platform was unveiled, and the disclosure has ratcheted from qualitative deal-volume commentary to a guided percentage of ARR. The framing has been consistent, which makes the guided IAM share the cleanest scorecard the company has given itself. |
| Enterprise and upmarket expansion of IAM | persisted | Q3 2025, Q4 2025, Q1 2026, Q2 2026, Q3 2026, Q4 2026, Q1 2027 | Introduced as departmental-level enterprise availability, then a top-down C-suite motion, then credit-based platform pricing. Management has described it as early on every one of these calls, which is a long run of the same qualifier. |
| Gross retention and dollar net retention improvement | persisted | Q2 2024, Q3 2024, Q4 2024, Q1 2025, Q2 2025, Q3 2025, Q4 2025, Q1 2026, Q2 2026, Q3 2026, Q4 2026, Q1 2027 | The through-line of the whole history: DNR fell to a stated low of 98%, was described as stabilized, then improved to 101%, 102% and over 102%. Management still attributes most of the gain to gross retention rather than IAM expansion. |
| Cloud data centre migration as a gross margin headwind | persisted | Q4 2024, Q1 2025, Q3 2025, Q4 2025, Q1 2026, Q2 2026, Q3 2026, Q4 2026, Q1 2027 | Flagged well in advance and repeatedly re-dated. The Q1 2027 call says the majority of site migrations are complete while still guiding full-year gross margin down slightly, so the headwind is narrowing rather than gone. |
| Buyback as the primary use of free cash flow | persisted | Q2 2024, Q3 2024, Q4 2024, Q1 2025, Q2 2025, Q3 2025, Q4 2025, Q1 2026, Q2 2026, Q3 2026, Q4 2026, Q1 2027 | Repurchase size has been described as a record in several consecutive quarters, with authorization raised repeatedly. M&A has been discussed as active but has produced one named deal, Lexion, in the reviewed history. |
| Distribution through frontier AI assistants and MCP | emerged | Q3 2026, Q4 2026, Q1 2027 | Absent before the Q3 2026 call and now a headline element of the prepared remarks and of analyst questions. It is presented as distribution and as a competitive answer at the same time, which is why analysts keep probing whether the model providers are partners or eventual substitutes. |
| Billings as a reported metric and early-renewal timing | dropped | Q2 2024, Q3 2024, Q4 2024, Q1 2025, Q2 2025, Q3 2025, Q4 2025, Q1 2026, Q2 2026, Q3 2026, Q4 2026 | Dominated guidance and Q&A for the entire history up to Q4 2026, which management flagged as the last billings report. Q1 2027 carries no billings guide and no early-renewal discussion in prepared remarks; the metric was retired after a quarter in which timing caused a guidance miss, so the reader should treat the change as both a simplification and a loss of a check on bookings. |
| Macro and customer spending scrutiny | dropped | Q2 2024, Q3 2024, Q4 2024, Q1 2025, Q2 2025, Q3 2025, Q4 2025, Q1 2026, Q2 2026, Q3 2026 | A standing question on every call from Q2 2024 through Q3 2026, including explicit tariff, interest-rate and public-sector versions, and a stated reason for added guidance conservatism in Q1 2026. Neither the Q4 2026 nor the Q1 2027 call contains a macro question or a macro caveat in guidance commentary. |
Guidance ledger
Quotes, calls, and speakers are source-verified; outcomes are curator-classified.
| Verbatim guidance | Call | Speaker | Curator outcome | Outcome note |
|---|---|---|---|---|
| “For billings, we expect $741 million to $751 million in Q1 or a 5% year-over-year growth rate at the midpoint” | DocuSign, Inc., Q4 2025 Earnings Call, Mar 13, 2025 · 2025-03-13T21:00:00 | Blake Grayson | missed | The Q1 2026 call reported billings of $740 million, up 4% year-over-year, and management stated billings ended slightly below the guidance range, attributing it to early renewals arriving sooner than forecast rather than demand. |
| “we expect full year fiscal 2026 billings between $3.300 billion to $3.354 billion or a 7% year-over-year growth rate at the midpoint” | DocuSign, Inc., Q4 2025 Earnings Call, Mar 13, 2025 · 2025-03-13T21:00:00 | Blake Grayson | kept | The Q4 2026 call reported full-year fiscal 2026 billings of $3.4 billion, up 10% year-over-year, above the original range despite the Q1 shortfall. |
| “We expect this IAM contribution to grow this fiscal year and anticipate it representing a low double-digit percentage share of our total subscription recurring revenue book of business by Q4 of fiscal 2026.” | DocuSign, Inc., Q4 2025 Earnings Call, Mar 13, 2025 · 2025-03-13T21:00:00 | Blake Grayson | kept | The Q4 2026 call reported IAM at over $350 million in ARR, or 10.8% of total company ARR, up from 2.3% at the end of fiscal 2025. Note the reporting base changed from subscription book of business to total ARR during the year. |
| “We expect non-GAAP operating margin between 26.5% to 27.5% for Q2 and 27.8% to 28.8% for fiscal 2026, unchanged for the full year.” | DocuSign, Inc., Q1 2026 Earnings Call, Jun 05, 2025 · 2025-06-05T21:00:00 | Blake Grayson | kept | Full-year fiscal 2026 non-GAAP operating margin was reported at 30%, above the guided range; Q2 fiscal 2026 operating margin came in at 29.8%. |
| “For billings, we expect $785 million to $795 million in Q3, or a 5% year-over-year growth rate at the midpoint” | DocuSign, Inc., Q2 2026 Earnings Call, Sep 04, 2025 · 2025-09-04T21:00:00 | Blake Grayson | kept | Q3 fiscal 2026 billings were $829 million, up 10% year-over-year. Management said roughly half the outperformance came from renewal timing and early renewal strength. |
| “we expect total revenue of $825 million to $829 million in Q4 or a 7% year-over-year increase at the midpoint and $3.208 billion to $3.212 billion for fiscal 2026 or an 8% year-over-year increase at the midpoint” | DocuSign, Inc., Q3 2026 Earnings Call, Dec 04, 2025 · 2025-12-04T22:00:00 | Blake Grayson | kept | Q4 fiscal 2026 revenue was $837 million, up 8% year-over-year, and full-year revenue was $3.2 billion, up 8%. |
| “For billings, we expect $992 million to $1.002 billion in Q4 or an 8% growth rate year-over-year at the midpoint” | DocuSign, Inc., Q3 2026 Earnings Call, Dec 04, 2025 · 2025-12-04T22:00:00 | Blake Grayson | kept | Q4 fiscal 2026 billings exceeded $1 billion for the first time, growing 10% year-over-year. Management said about half the outperformance versus guidance was timing, with the remainder from FX and bookings. |
| “we expect $822 million to $826 million in Q1 or an 8% year-over-year increase at the midpoint” | DocuSign, Inc., Q4 2026 Earnings Call, Mar 17, 2026 · 2026-03-17T21:00:00 | Blake Grayson | kept | Q1 fiscal 2027 revenue was $830 million, up 9% year-over-year, with an approximately 1.6 percentage point benefit from foreign exchange rates. |
| “We expect a year-over-year growth rate range of 8.25% to 8.75% or an 8.5% year-over-year increase to $3.551 billion at the midpoint at the end of Q4 of fiscal 2027.” | DocuSign, Inc., Q4 2026 Earnings Call, Mar 17, 2026 · 2026-03-17T21:00:00 | Blake Grayson | pending | Reiterated unchanged on the Q1 2027 call. Management said it intends to revise the ARR forecast only as full-year bookings expectations evolve, and that visibility builds later in the year given second-half weighting. |
| “We expect IAM to represent approximately 18% of our total ARR at the end of Q4 fiscal 2027, driving IAM to well over $600 million in ARR by the end of this year.” | DocuSign, Inc., Q4 2026 Earnings Call, Mar 17, 2026 · 2026-03-17T21:00:00 | Blake Grayson | pending | Reiterated on the Q1 2027 call, where IAM reached 12.6% of total ARR, up from 10.8% the prior quarter. |
| “For revenue, we expect $865 million to $869 million in Q2 or an 8% year-over-year increase at the midpoint and $3.490 billion to $3.502 billion for fiscal 2027 or a 9% year-over-year increase at the midpoint.” | DocuSign, Inc., Q1 2027 Earnings Call, Jun 04, 2026 · 2026-06-04T21:00:00 | Blake Grayson | pending | Management flagged a harder Q2 comparison, noting Q2 of fiscal 2026 was the highest quarterly growth of that year, driven mostly by higher digital usage. |
| “We expect non-GAAP operating margin to reach 29.7% to 30.2% for Q2 and 30.5% to 31.0% for fiscal 2027, an increase of 0.5% at the midpoint versus prior guidance.” | DocuSign, Inc., Q1 2027 Earnings Call, Jun 04, 2026 · 2026-06-04T21:00:00 | Blake Grayson | pending | The only guidance raise on the Q1 2027 call. Q1 outperformance was attributed to four roughly equal components, one of which was an insurance legal reimbursement related to prior periods. |
Q&A pressure map
Question counts and firms are curator tallies; analyst coverage shown above.
| Topic | Questions | Firms | Pressure / response |
|---|---|---|---|
| Enterprise IAM traction and go-to-market readiness | 19 | William Blair & Company L.L.C., Research Division, Citigroup Inc., Research Division, Wolfe Research, LLC, BofA Securities, Research Division, Jefferies LLC, Research Division, Morgan Stanley, Research Division, Citizens JMP Securities, LLC, Research Division, Evercore ISI Institutional Equities, Research Division, Wells Fargo Securities, LLC, Research Division | The most persistent line of questioning across the reviewed window: whether the sales force, partner channel and product are actually ready for large-enterprise deployments rather than departmental lands. Management has answered consistently and candidly, but has described the effort as early on every call from Q3 2025 through Q1 2027. |
| Billings volatility, early-renewal timing and the move to ARR reporting | 18 | Citigroup Inc., Research Division, Morgan Stanley, Research Division, Wolfe Research, LLC, William Blair & Company L.L.C., Research Division, Wells Fargo Securities, LLC, Research Division, Robert W. Baird & Co. Incorporated, Research Division, Piper Sandler & Co., Research Division, Citizens JMP Securities, LLC, Research Division, JPMorgan Chase & Co, Research Division | Concentrated on the Q1 2026 call, where the billings miss drew questions from most of the covering firms, including Pat Walravens asking directly when management knew billings would come in below guidance. Michael Turrin asked on that same call whether ARR should replace billings; the company announced exactly that change on the Q3 2026 call. |
| Quantifying the IAM uplift and expansion economics | 10 | Evercore ISI Institutional Equities, Research Division, Jefferies LLC, Research Division, Morgan Stanley, Research Division, William Blair & Company L.L.C., Research Division, RBC Capital Markets, Research Division, Piper Sandler & Co., Research Division, Wolfe Research, LLC | Asked in some form on most calls since Q4 2025 and refused every time. Management describes the uplift as meaningful, significant or accretive but has never given a rate. On the latest call Rob Owens asked twice in a row and was told the company does not intend to start disclosing it, so investors are still modelling the central IAM economics from inference. |
| Macro and demand environment | 10 | Morgan Stanley, Research Division, Evercore ISI Institutional Equities, Research Division, Jefferies LLC, Research Division, BofA Securities, Research Division, JPMorgan Chase & Co, Research Division, Wells Fargo Securities, LLC, Research Division, Citigroup Inc., Research Division, Piper Sandler & Co., Research Division | Recurring through Q3 2026 and answered the same way each time: no material impact visible in envelope volumes or consumption, with real estate consistently named as the slower vertical. The line of questioning disappears entirely on the Q4 2026 and Q1 2027 calls. |
| Timing and credibility of the double-digit growth goal | 6 | Jefferies LLC, Research Division, Wolfe Research, LLC, William Blair & Company L.L.C., Research Division, BTIG, LLC, Research Division, Citizens JMP Securities, LLC, Research Division | Asked roughly once a year by different firms and never answered with a date. On the Q4 2026 call Grayson said the timing was not as important to him at the moment and that there was nothing to share on a timeline; on the Q1 2027 call Walravens asked what had been harder than expected and Thygesen answered about not having set a timeline rather than naming an obstacle. Both answers plainly leave the direct question unaddressed. |
| Competitive position versus LLM providers and CLM vendors | 6 | Citizens JMP Securities, LLC, Research Division, RBC Capital Markets, Research Division, JPMorgan Chase & Co, Research Division, Wells Fargo Securities, LLC, Research Division, William Blair & Company L.L.C., Research Division | Rising in frequency as the model partnerships expand. Rishi Jaluria framed it explicitly as investor worry about competition from do-it-yourself use of those platforms or from the platforms themselves. Management's answer is stable across calls: consented private agreement data, cross-functional workflow coverage and trust. |
Language shifts
Only language evidence verified against the referenced component is shown.
| Observation | Verbatim evidence | Call ID | Component |
|---|---|---|---|
| The clearest caution language in the reviewed history sits in Q1 2026, where management explicitly widened its own forecasting assumptions after the billings miss. This is the only instance of an announced change in forecasting posture. | “We will take a more conservative approach to forecasting the timing of early renewals for the remainder of fiscal 2026 in light of the go-to-market changes.” | 1943712123 | 3 |
| Macro caveats were still being written into guidance commentary in Q1 2026. No equivalent hedge appears in the Q4 2026 or Q1 2027 guidance sections, which is a change in register rather than a stated change in view. | “While we do not see any material macro impact on our Q1 results, we are taking a cautious approach for the remainder of fiscal 2026 given the uncertain economic environment.” | 1943712123 | 3 |
| Q3 2026 marks the retirement of the metric that had generated the most Q&A friction. The company framed it as investor-driven transparency; it also removes the disclosure that produced the Q1 2026 guidance miss. | “Finally, as previously discussed, we will no longer report billings in fiscal 2027.” | 1970296676 | 3 |
| Confidence vocabulary steps up in Q4 2026. Prior calls used aspiration language about reaccelerating; this is a direct positioning statement, and it was made in the same breath as the first formal ARR guide. | “We are positioned to begin accelerating the business.” | 1986335804 | 2 |
| Against that confidence, the IAM retention evidence is still hedged. Grayson twice qualified the favourable renewal-cohort data by its sample size on the same call. | “I'm going to preface this by a very early days of our first renewal cohort. So the sample size is pretty small.” | 1986335804 | 23 |
| On the latest call the prepared remarks describe DNR as sequentially up over the last seven quarters, but under direct questioning Grayson added a qualifier that materially softens that claim. The two statements are consistent but read very differently. | “on a rounded basis, it's been flat for the past few” | 2000673338 | 61 |
| New product vocabulary in Q1 2027 shifts IAM from repository and workflow language to agentic and system-of-action language, tracking the MCP and model-partner theme rather than any change in the disclosed financial framework. | “At Momentum, we introduced agentic offerings that advance IAM's transformation into a system of action.” | 2000673338 | 2 |
| Thygesen's response to the sharpest challenge of the latest call is defensive in a way earlier answers were not, opening with a denial that a commitment existed rather than with evidence. | “I don't know that we ever set a time line. I'm not disappointed with our progress.” | 2000673338 | 21 |
The call history supports the operational case and leaves the valuation case open. Retention, consumption and margin have improved steadily over the past 3 years, and IAM has gone from a launch to a guided share of ARR without a visible stumble. What the transcript history does not contain is a disclosed uplift rate for IAM, a date for double-digit growth, or a billings-style check on bookings now that the metric has been retired. The debate therefore rests on whether the 8.5% ARR guide converts into the acceleration management has described, and investors have less independent evidence with which to test that than they had a year ago.
Competitors describe DocuSign, Inc.'s market in their own filings and calls. These verified passages and visual pages show where their strategies meet, using source documents preserved in Sources.
Adobe Inc. (ADBE)
Adobe is the largest direct rival to Docusign's core eSignature product. Acrobat Sign is not sold as a stand-alone signing service but bundled into Acrobat subscriptions, so the competitive question is whether signing gets absorbed into a document suite that already reaches hundreds of millions of users. Only Adobe's Acrobat / document-productivity (Business Professionals & Consumers) disclosure is used here; the Creative Cloud and Digital Experience businesses are outside the comparison.
The FY2025 10-K description of the same franchise a year later. Acrobat Sign no longer appears as a separately described principal solution; signing is folded into the Acrobat plan description as “subscribers can convert, edit, request signatures, and protect PDFs.” Read alongside the FY2024 language, this is Adobe presenting e-signature as a feature of a PDF subscription rather than a product line of its own.
Acrobat is our family of productivity solutions that allows users to consume, edit, sign, and create documents across platforms and surfaces, and better understand the information within them. Our Adobe Acrobat solutions are available on desktop, mobile, and the web with Acrobat Studio, Acrobat Pro, Acrobat Standard tiered plans, and for free with Adobe Acrobat Reader. […] Adobe Acrobat is our comprehensive PDF solution with a full set of tools to convert, edit, share and sign PDFs across various surfaces and platforms. Acrobat enables automated, collaborative workflows with a rich set of commenting, editing and sharing tools and direct integration with Adobe Acrobat Sign. With the Acrobat Standard plan, subscribers can convert, edit, request signatures, and protect PDFs. The Acrobat Pro plan offers additional advanced PDF features.
p. 6 · Read in context →
Adobe's reported scale for the customer group that contains Acrobat and Acrobat Sign, from the Q2 FY2026 call. The ‘Business Professionals & Consumers’ group is far broader than signing — it includes Acrobat, Express and Acrobat AI Assistant — and the 850 million MAU figure is free-and-paid usage across those apps, not signing customers. What it shows is the size of the installed base into which Adobe can distribute a signing feature.
Steven Day (Interim CFO & Senior Vice President, Corporate Finance): Business professionals and consumers subscription revenue was $1.85 billion increasing 16% year-over-year as reported or 15% in constant currency. Q2 growth drivers for Business Professionals and Consumers included sustained double-digit ending ARR year-over-year growth across all geographies. Acrobat and Express MAU surpassed 850 million growing approximately 20% yearover-year. Acrobat AI Assistant ARR growing approximately 3x year-over-year and strong performance in the enterprise across both commercial and government.
p. 6 · Read in context →
OneSpan Inc. (OSPN)
OneSpan is the closest thing in the peer set to a pure-play e-signature competitor: its Digital Agreements division sells OneSpan Sign into banks and other regulated enterprises, and its 10-K names Docusign as one of only two primary competitors in the category. Its management also argues explicitly against seat-based pricing — the model Docusign monetises on. Only the Digital Agreements commentary is used; the Cybersecurity/authentication division does not overlap with Docusign.
OneSpan's competition disclosure in its FY2025 Form 10-K. It defines the market it competes in as a single combined security/authentication/identity/e-signature/workflow market, flags AI-enabled low-cost software development as a source of intensifying competition, and names Docusign and Adobe as its two primary e-signature competitors while conceding both are significantly larger.
The market for digital solutions for security, authentication, identity, electronic signature, and digital workflow products is very competitive and, like most technology-driven markets, is subject to rapid change and constantly evolving solutions and services. Competition in our markets may intensify further as advances in AI enable rapid, low-cost development of software applications. […] Our primary competitors for electronic signature solutions are Docusign and Adobe Systems. Both companies are significantly larger than us. In addition to these companies, there are numerous smaller and regional or niche providers of electronic signing solutions.
p. 9 · Read in context →
OneSpan's stated read on the e-signature replacement cycle, from the market-trends section of the same 10-K. It characterises COVID-era e-signature deployments as siloed, hard to customise, costly to scale and in some cases a security risk, and argues buyers are now consolidating them on cost and total-cost-of-ownership grounds. This is a challenger's framing of the incumbent installed base and is offered as such, not as an established market fact.
At the same time, organizations are reassessing their e‑signature foundations. Many tools adopted rapidly during the COVID era were deployed in silos, offer limited customization, are costly to scale, and, in some cases, introduce additional security risks. As companies consolidate these fragmented deployments, they are prioritizing cost‑effective, enterprise‑wide solutions that support broad use‑case coverage and deliver a lower total cost of ownership.
p. 6 · Read in context →
OneSpan's CEO drawing an explicit contrast on pricing model in the Q1 FY2026 call: about 97% of its Digital Agreements business is priced on expected e-signature transactions or documents rather than on employee or user counts. The passage is an unprompted statement of positioning against seat-based licensing, which is how Docusign's eSignature business is largely sold.
Victor T. Limongelli (Chief Executive Officer): Last but not least, I want to reiterate that neither our digital agreements business nor our cybersecurity business has seat-based licensing as the primary revenue model. In cybersecurity, we sell to our customers based on the number of their end users and not based on the number of their employees or seats. Our licenses are tied to the number of consumers using strong authentication or app shielding solutions. Similarly, in digital agreements, the vast majority of our business, about 97%, is priced based on the number of expected e-signature transactions or documents rather than customer employee counts or user counts.
p. 2 · Read in context →
Box, Inc. (BOX)
Box competes with Docusign by bundling: Box Sign, Box Doc Gen and Box Apps are packaged inside its Enterprise Advanced plan alongside content management and AI, so signing arrives as part of a platform deal rather than as a separate purchase. Box's 10-K explicitly adds e-signature to the list of markets it now competes in, and its earnings calls describe displacing an e-signature vendor in a platform consolidation. Box's storage/file-sync business is outside the comparison.
How Box defines and sizes its market in the FY2025 Form 10-K — large, highly competitive and highly fragmented — and its statement that expanded product scope now puts it in competition with e-signature and workflow-automation companies. Box names Microsoft, OpenText, Google and Dropbox as specific competitors elsewhere on the page but does not name Docusign; the e-signature overlap is asserted at the category level.
The content management market is large, highly competitive and highly fragmented. It is subject to rapidly evolving technology, shifting customer needs and frequent introductions of new products and services. We face competition from a broad spectrum of technology providers: traditional content management vendors who deploy on-premise and offer deep records management, business process workflow, and archival capabilities; newer enterprise vendors who are beginning to enter the content collaboration market; vendors whose core competency is simple file sync and share, which can be deployed on-premises, hybrid, or via a SaaS delivery model; and social collaboration vendors who focus on the conversations that occur between teams. With our expanded produc offerings and use cases, we also now compete with companies in the e-signature, content collaboration, workflow automation, AI, and security and governance markets.
p. 12 · Read in context →
A displacement claim from Box's Q2 FY2026 call: a US law firm signing an enterprise-wide Enterprise Advanced agreement that Box says replaced both a cloud platform vendor and an e-signature company. Box does not name the displaced vendor, and this is a single anecdote offered as an adoption example rather than a quantified share shift — but it is the shape of competition Docusign faces from platform bundling.
Aaron Levie (Co-Founder and CEO): We had strong momentum in Q2 in customer adoption of Enterprise Advanced, which brings together our most powerful intelligent workflow capabilities in one plan. Examples include a prominent US law firm that became a new customer to Box, driven by Enterprise Advanced AI-powered metadata extraction capabilities and intelligent no-code apps to power its business processes. This is an enterprise-wide agreement replacing both an existing cloud-based platform vendor and an eSignature company.
p. 1 · Read in context →
Box's Q4 FY2026 update on the bundle that carries its signing product: Enterprise Advanced reached 10% of revenue in its first year. The customer example describes quote creation and approvals running on Box Doc Gen, Box Sign and Box Apps together — document generation plus signature plus workflow, the same combination Docusign sells as intelligent agreement management.
Aaron Levie (Co-Founder and CEO): Enterprise Advanced customers have reached 10% of revenue, and we're incredibly excited about this early traction and continued momentum. Examples of Enterprise Advanced customer wins include a leading biotech company uses Box to manage large volumes of commercial documents but currently relies on manual searches to find key information. By upgrading from Enterprise Plus to Enterprise Advanced, the company will use AI-powered data extraction and integrated apps to surface critical commercial data directly from documents. Next, a leading global robotics company uses Box as the core platform for its revenue operations and content workflows. The company upgraded from E Plus to Enterprise Advanced to streamline quote creation and approvals with Box Doc Gen, Box Sign and Box Apps to increase throughput and reduce errors.
p. 1 · Read in context →
GMO GlobalSign Holdings K.K. (3788)
GMO GlobalSign Holdings runs GMO Sign (電子印鑑GMOサイン), the electronic-contract service that competes with Docusign in Japan, alongside a certificate-authority business. It is the one peer here that publishes hard penetration and volume metrics for a national e-signature market, and it is simultaneously a supplier to Docusign — GlobalSign certificates sit underneath Docusign's signatures. Only the electronic certification / e-seal segment is used; GMO's hosting and other businesses are not.
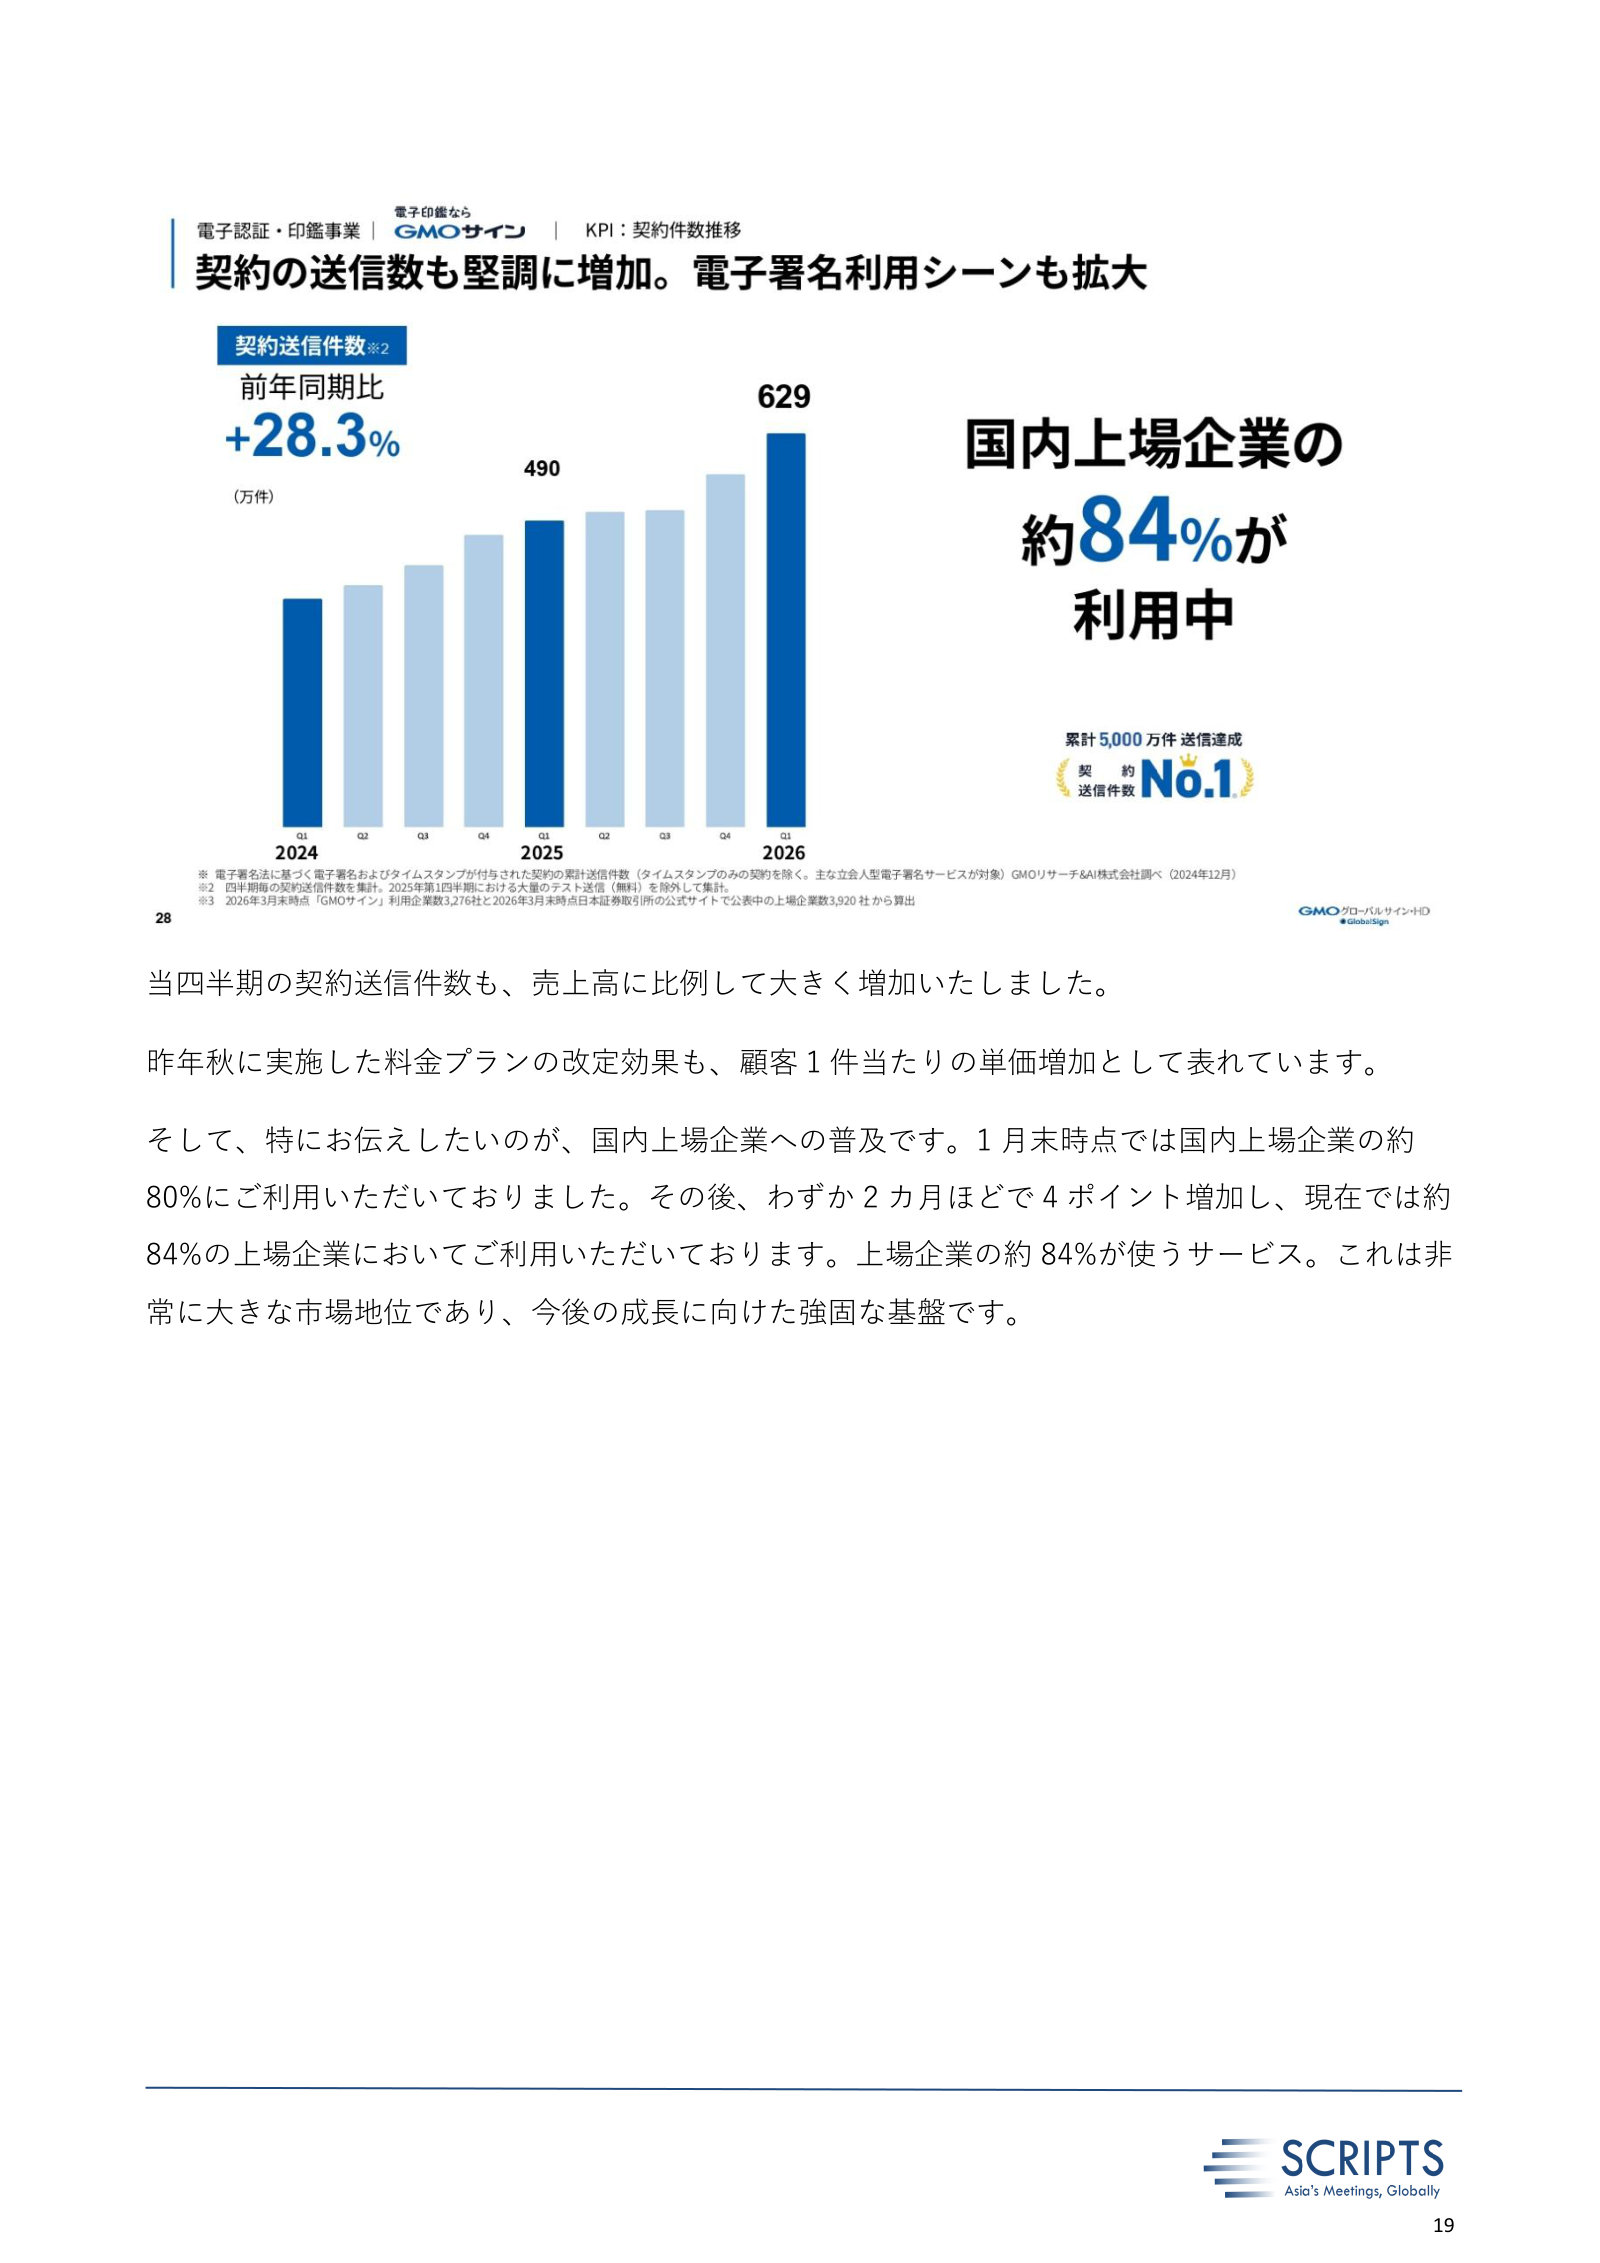
The revenue and ARR commentary from the facing page of the same Japanese-language deck. GMO Sign quarterly revenue of ¥584 million, up 28.7% year over year, with ARR growth held above 30%; the chart on the page puts ARR at ¥2,252 million, roughly US$15 million at current rates. Set against the 84% penetration claim on the next page, this is what that reach converts into — broad usage across Japanese listed companies at very low revenue per customer.
Mitsuru Aoyama (President and Representative Director): こちらはGMOサインの売上高およびARR、つまり年間定期収益の四半期推移です。当四半期の売上は前年同期比28.7%増の 5億 8,400万円となりました。ARRも 30%以上の成長を維持しております。
p. 19 · Read in context →
GMO naming Docusign in its Q3 FY2025 deck — as a customer, not a rival. Management states that its electronic signatures are adopted by ‘fast-growing electronic-contract providers Docusign and Adobe’ for their signing, and that signature volumes have grown 2.5x in five years to 5 million per month. The passage documents a supplier relationship running underneath a competitive one: GMO sells trust-service infrastructure to the same vendors GMO Sign competes with in Japan.
Mitsuru Aoyama (President and Representative Director): また当社が提供する電子署名については、海外では請求書や卒業証明書などにも多く使われておりますし、また急成長している電子契約事業者Docusignや Adobe社の署名にも採用されております。電子署名の数は5 年前と比べて 2.5倍の月間500万件と伸長しており、今後もさらに拡大するものと思われます。
p. 12 · Read in context →
Dropbox, Inc. (DBX)
Dropbox owns Dropbox Sign (the former HelloSign) and DocSend, and its 10-K names Docusign directly as an e-signature competitor. It is the clearest example in the peer set of a platform company that bought into e-signature and then chose to run it for cash rather than growth — useful as a read on how a scaled adjacent player values the category. The storage and Dash search businesses are outside the comparison.
Dropbox's competition section in its FY2025 Form 10-K. Docusign is named, but note the qualifier Dropbox itself applies: it competes in the e-signature market ‘on a more limited basis’, grouped with Box and Adobe, while its primary competitive framing is cloud storage and content collaboration against Microsoft, Google and Apple.
The market for content collaboration platforms is competitive and rapidly changing. Certain features of our platform compete in the cloud storage market with products offered by Microsoft, Amazon, Apple, Google, and Adobe and in the content collaboration market with products offered by Microsoft, Atlassian, Slack (now part of Salesforce) and Google. On a more limited basis, we compete with Box in the cloud storage market for deployments by large enterprises as well as in the e-signature market along with Adobe and DocuSign and in the AI content search market along with Glean, Guru and Notion. We also compete with smaller private companies that offer point solutions in the cloud storage market or the content collaboration market.
p. 13 · Read in context →
Dropbox's CEO separating its document-workflow assets by investment posture on the Q2 FY2025 call: continued investment in DocSend, while Sign and FormSwift are run ‘for maximum profitability.’ Management does not disclose e-signature revenue, so this is a statement of intent rather than a performance figure — but it indicates that one of the named e-signature competitors is harvesting the product rather than contesting the category.
Andrew W. Houston (CEO): Across our document workflow business, we continue to invest in DocSend, and we've improved document upload flows, processing speeds, and simplifying sharing and permissions. These improvements are resonating with customers, as DocSend continues to grow at a double-digit pace year-over-year. As mentioned previously, we remain focused on operating both Sign and FormSwift for maximum profitability, and both of these business lines continue to perform well against this objective.
p. 2 · Read in context →
eMudhra Limited (EMUDHRA)
eMudhra is a certifying authority and paperless-transformation vendor in India, the Middle East and Africa, whose emSigner product competes with Docusign in markets where trust services and local certificate regulation matter. Its annual report names Docusign in its competitive landscape, and its calls quantify the volume-versus-price dynamics of e-signature in an emerging market — a different economic model from Docusign's envelope and seat pricing. Its cybersecurity and IT-services businesses are outside the comparison.
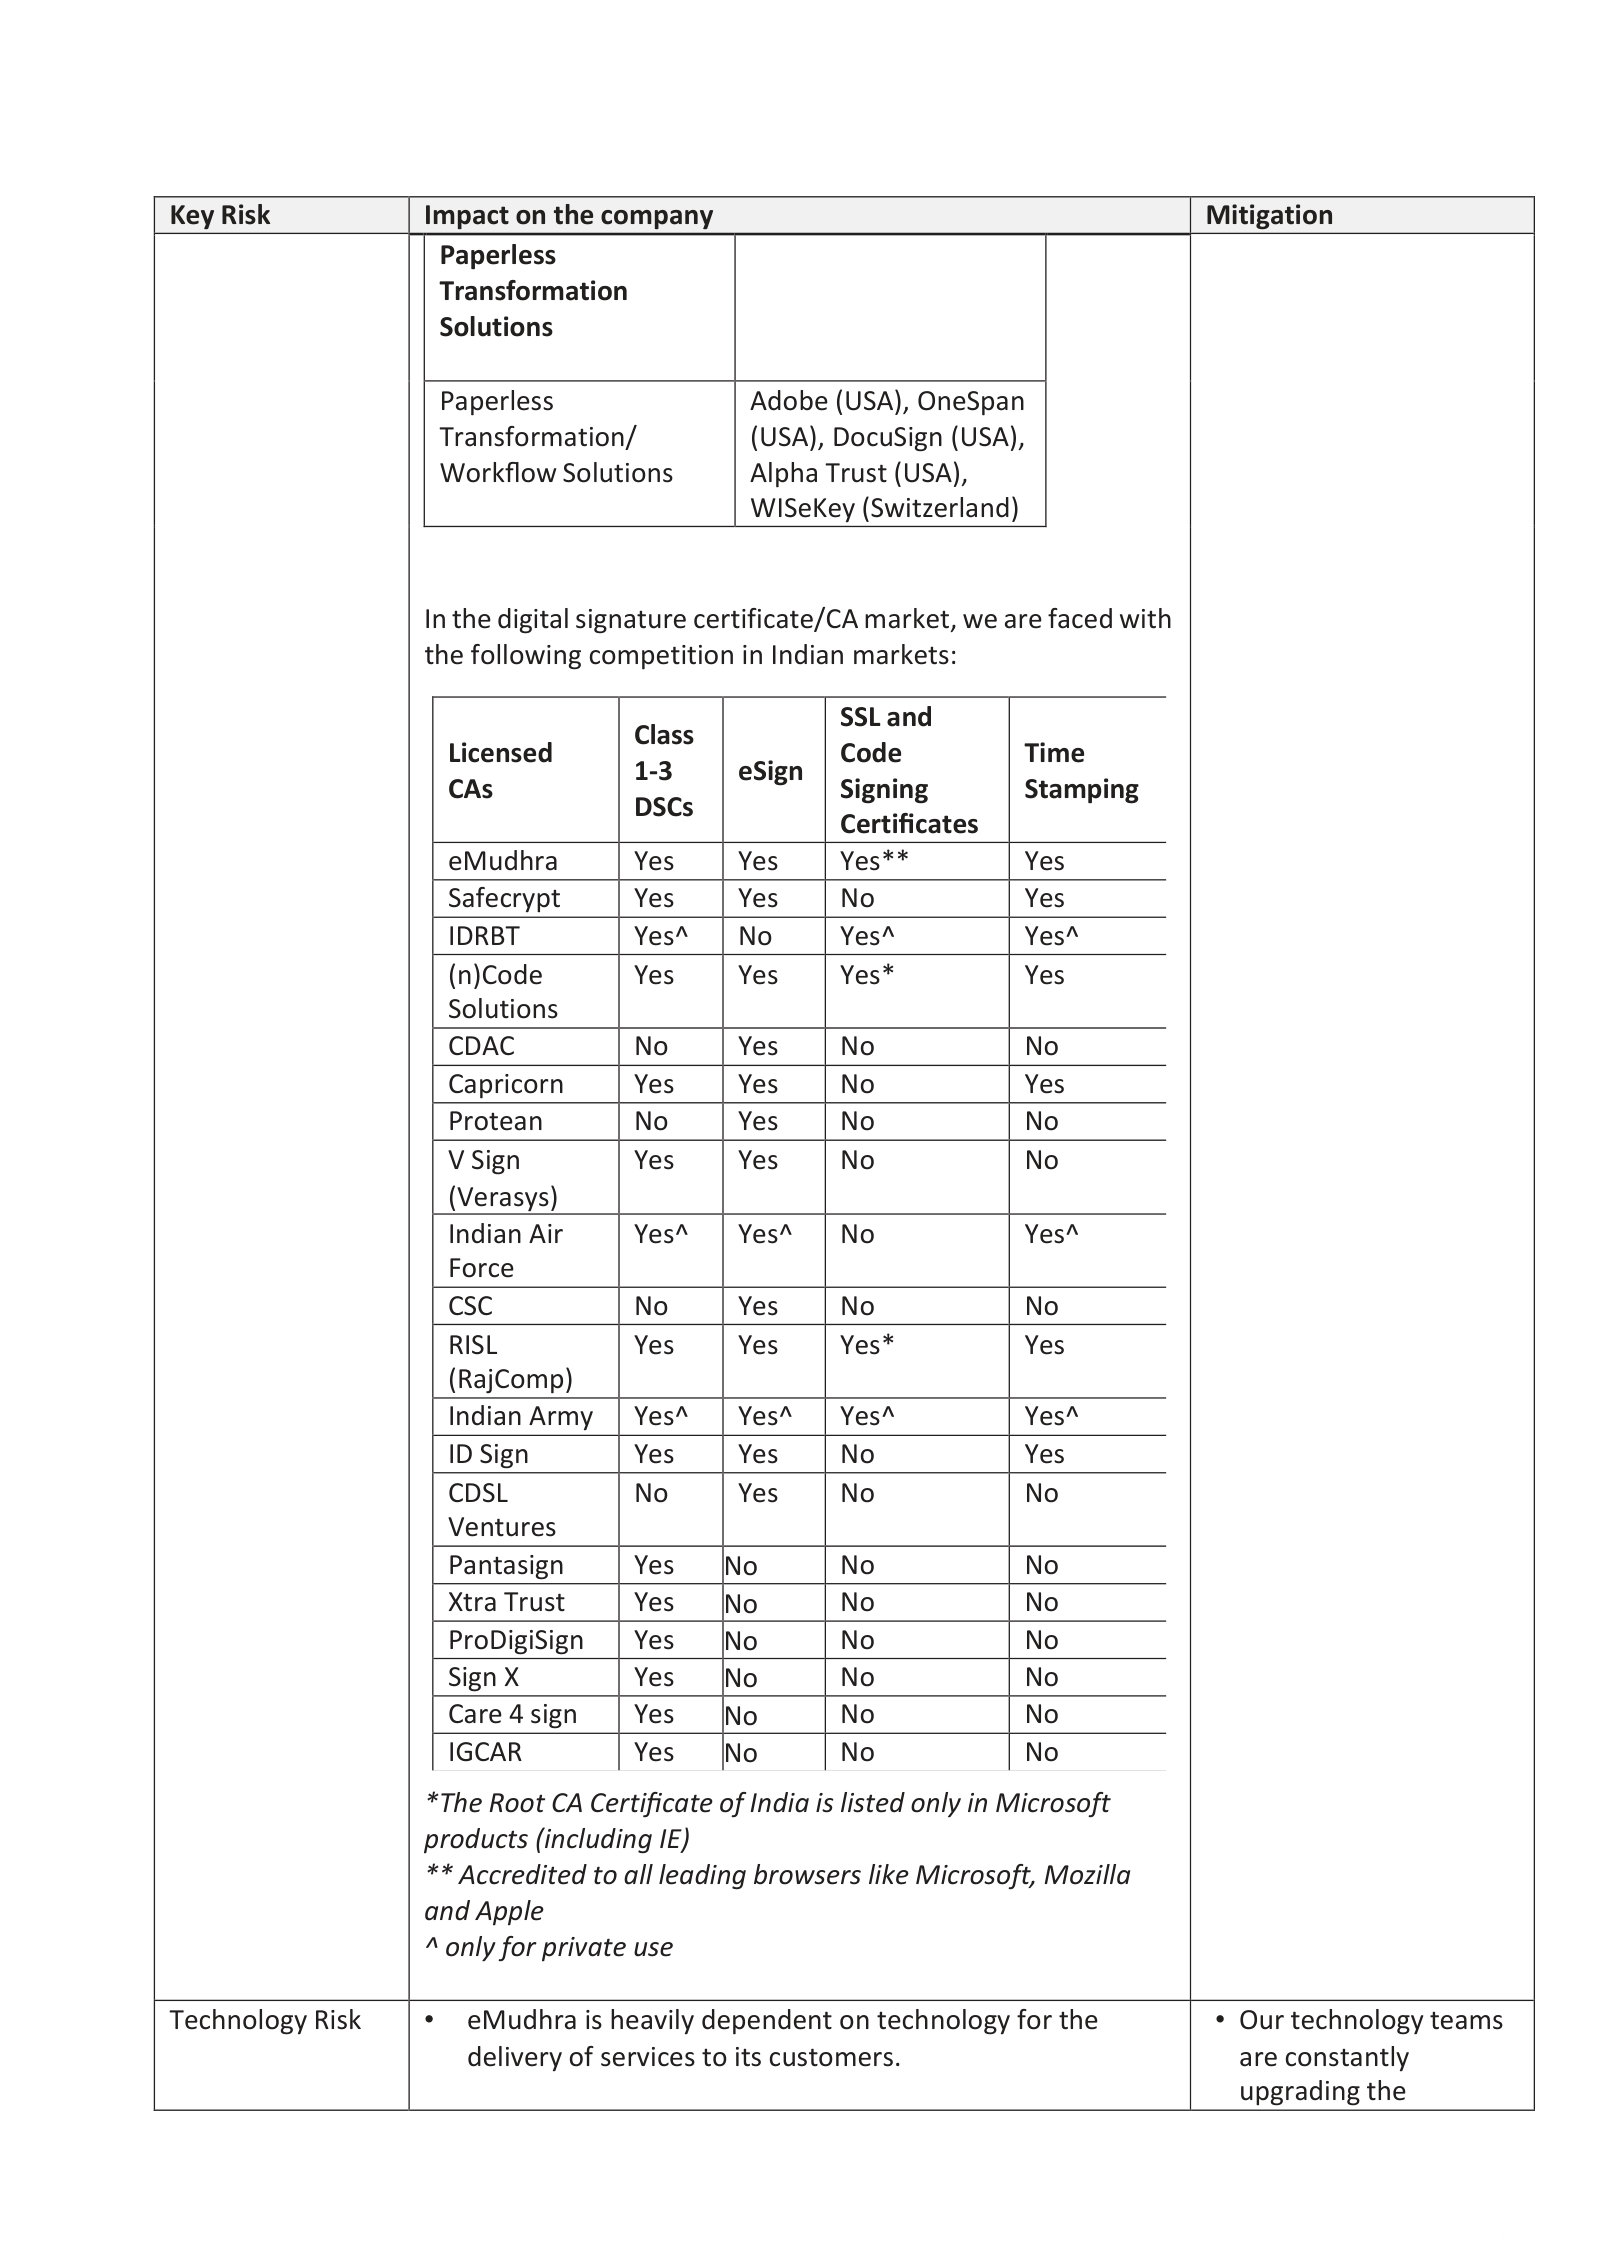
eMudhra's Executive Chairman on e-signature volumes in the Q2 FY2026 call: daily e-signature transactions up from 30,000–40,000 to roughly 300,000 (3 lakh), with an explicit acknowledgement that revenue per signature is low. The exchange is about eMudhra's trust-services line in India, and it illustrates the pricing level at which high-volume e-signature is transacted in that market.
Venkatraman Srinivasan (Executive Chairman): So mainly the growth this time has come more from the e-signature because e-signature is of the trust services. And a lot of earlier we were doing 30,000, 40,000 eSignature per day. Today, we are doing almost 3 lakh e-signature per day. But though the revenue per signature revenue is less, but some growth.
p. 11 · Read in context →
More peer documents
OneSpan — FY2024 Form 10-K — FY2024 · 105 pages · Pages 8 and 14 carry the prior-year wording of the same competition section naming DocuSign and Adobe — the comparison that shows whether OneSpan’s framing of the e-signature market has shifted. · Open →
OneSpan — Q4 FY2025 earnings call — Q4 FY2025 · 8 pages · Page 2 is the fullest statement of OneSpan’s Digital Agreements pitch — “industry-leading price-to-value”, gross retention improving past 90%, and an explicit build-versus-buy argument against enterprises replicating a signing platform. · Open →
Adobe — Q1 FY2026 earnings call — Q1 FY2026 · 13 pages · Pages 2, 5 and 11 lay out the Acrobat freemium funnel — 850 million MAU, the paywall mechanics management describes as “the first freemium funnel around software”, and the segment ARR behind it. · Open →
Box — Q3 FY2026 earnings call — Q3 FY2026 · 10 pages · Page 2 introduces Box Automate and Box Extract and states the ambition to “power any end-to-end document workflow” — the workflow layer above signing that Box is building. · Open →
Dropbox — FY2024 Form 10-K — FY2024 · 121 pages · Pages 13 and 20 give the prior-year competitor list naming Adobe and DocuSign, before the AI-content-search competitors were added — useful for tracking how Dropbox’s stated competitive set is drifting away from e-signature. · Open →
eMudhra — Q4 FY2026 earnings call — Q4 FY2026 · 12 pages · Page 4 gives the FY2027 plan: over 3 lakh daily e-sign transactions in Indian banking, e-signature rollouts across the Middle East and Africa, and emSigner targeted at the untapped India MSME and banking segments. · Open →
GMO GlobalSign Holdings — Q4 FY2025 results presentation — Q4 FY2025 · 30 pages · Pages 18–20 hold the full-year GMO Sign story — a stated domestic share No.1, 50 million cumulative sends, FY revenue of ¥1,997 million (+31.3%), and the plan-repricing move management credits for rising revenue per customer. · Open →
Fit
Outside the framework's universe (U2 not met); contested: P5
Docusign misses the framework's scale line: a market capitalization of $9.84B against the greater-than-$10B universe test. Confidence is low, on the tally's computed basis — a load-bearing criterion was contested or a load-bearing probability spread exceeded 0.25 (P5, spread 0.26). No exclusion was hit, the China sensitivity flag was not raised, the watchlist-only flag is not set, and the name-mask probe raised no prior-driven risk.
Universe and exclusions
Here is the decisive point. The miss is not a judgment on the business; it is a size test, and Docusign is 1.6% under it.
Market cap ($B)
Universe line ($B)
Close, 23 Jul 2026
Price that clears the line
Derived from fit_features.market_cap: price $47.04 on 2026-07-23 times 209,118,000 shares = $9,836,910,720. The break-even price ($10.0B / 209.118M = $47.82) is derived from those same feature inputs and is not stated in any filing. Share count from the FY2026 Form 10-K [1].
U2 is not met: $9.837B against a $10.0B line, a gap of 1.6%. A share price of $47.82, up 1.66% from $47.04, clears it. The framework's rule is applied as written, and the tally's gate reads U2 not_met to out_of_universe.
The counter-fact belongs in the same breath: this is the narrowest possible miss, and it is a price-of-the-day fact rather than a finding about the company. The skeptic pass weakened the underlying claim in one respect — the external-tracker corroboration ($8.6–9.0B) was struck from the corpus-only record, leaving the deterministic feature as the sole basis. The listing test is clean: Docusign is a Delaware corporation whose common stock trades on the Nasdaq Global Select Market under the symbol DOCU, not an ADR and not a Chinese issuer [2]. The full treatment is in Business.
The exclusion screen is clean. All four disqualifying exclusions were checked and none
was hit; the tally's exclusion_hits list is empty. Docusign manufactures no vehicles — its
named competition is Adobe Acrobat Sign plus software vendors
[3],
so X1 does not apply. X2 (promotion pattern) requires both prongs: insider economic ownership
is thin — directors and executive officers hold under 1% of the 195,945,841 shares
outstanding, with no open-market purchases
[4] —
but the delivery record is mostly met or beaten (FY2026 billings $3.4B against a
$3.30–3.354B guide, non-GAAP operating margin 30% against 27.8–28.8%)
[5],
with one timing-driven Q1 FY2026 billings miss, so the repeated promise-versus-delivery gap
is not established. X3 (structural decline) does not fire mechanically: revenue has risen in
every fiscal year on record and revenue_trajectory.three_year_hsd_decline reads false. X4
(consensus-saturated story) does not fit a name at roughly 3.1x sales, 61% below its peak,
with sixteen of eighteen ratings at hold. S1 (China dependence) is absent: China is not
mentioned across the FY2022–FY2026 annual reports, and non-US long-lived assets are $89.9M
of $528.6M in total
[6].
Pattern match
Docusign fits none of the framework's four setups. It is not a cyclical at the bottom and not a large bank. It pays no dividend and does not expect to [7], so the yield-plus-dividend pattern cannot apply. It is not an insurer mis-forecasting a cost trend, and there is no premium-repricing mechanism to underwrite.
The nearest neighbour is the fourth setup — a quality technology franchise on a fear dip — and it fails that pattern's two specific checks. The structure check asks for a monopoly or duopoly; the filings describe one primary global competitor (Adobe) alongside content-cloud bundlers, providers of large language models, and customers' own homegrown alternatives, in a category whose enabling laws (ESIGN, UETA, eIDAS) are vendor-neutral rather than protective [3]. The fear check asks whether the specific fear is testable; the AI-substitution fear is specific but shows no signature yet in the usage data — dollar net retention was over 102% in Q1 FY2027, up more than a point year over year and sequentially higher for seven quarters, with consumption at multi-year highs and customers spending over $300,000 in annual contract value up 12% [8]. An untestable fear is neither confirmed nor cleared, which is why the diagnosis criterion ends contested rather than decided.
The pillar ledger
Source: the run's deterministic fit tally (per-criterion aggregates, votes and spreads); the arithmetic behind each row is cited in the sections that follow.
Year-10 durability — P1
Not met, at probability 0.575 with a spread of 0.10; all four seats agreed and both model families agreed, and the name-masked seat returned the same result. The gate asks for very high conviction that year-10 revenue and adjusted free cash flow are both higher than today's. The conviction sources grade poorly: capital intensity is absent — capex of $106.4M [9] on revenue of $3,219.5M [1], 3.3%; the regulatory regime enables the category for any compliant vendor rather than gating entry; and the market is fragmented rather than a duopoly [3]. The company's own risk factor is prominent on the point: advances in AI "have made and may continue to make some foundational capabilities for agreements … cheaper and easier to replicate" [10]. IAM was 12.6% of total annual recurring revenue at 30 April 2026, guided to about 18% at fiscal year end, which leaves roughly 82% of the recurring base in the exposed legacy capability [8].
The strongest surviving counter-fact sits inside the same treatment: decline is not the base case. Revenue has risen in every fiscal year on record, reported free cash flow rose to $1,058.6M in FY2026, the balance sheet is net cash, and consensus models free cash flow rising to about $1,328M by FY2029. What the gate withholds is conviction, not a forecast of shrinkage — and by construction, genuine doubt resolves to not met. Full treatment in Durability.
FCF consistency — P2
Not met, four seats unanimous, no probability recorded. The deterministic
fit_features.fcf_stability series is not_computable because stock-based compensation is
absent from the structured cash-flow feed, so the series below is reconstructed from the
filed cash-flow statements and is an analyst derivation rather than the feature.
Adjusted FCF = reported FCF − stock-based compensation − trailing five-year average acquisition spend; derived from the filed cash-flow statements [9]. The deterministic feature is not_computable for this series.
Three positive years on the adjusted basis is a rising ramp, not the stable rolling five-year average the criterion asks for, and the two negative years are early-stage compensation drag rather than a business-model-inherent cycle recurring every five to eight years. The counter-fact in the same treatment: reported free cash flow has risen every year from $445.1M to $1,058.6M, subscription cash flows recur rather than cycle, and the objection is the length of the adjusted record and its dependence on compensation compression — not volatility. Full treatment in Durability.
Dislocation and yield — P3a, P3b, P3c, P3d
P3a — identifiable event: met, unanimous. The dated trigger is the 5 June 2025 first-quarter report: the full-year billings guidance midpoint was trimmed from $3,327M to $3,312M, about 0.45%, on a self-inflicted early-renewal and sales-compensation change [11], and the stock fell 18.97% the next session on 22.6M shares, 8.9 times the 50-day average. The counter-fact: revenue guidance was raised $22M the same day, and the two larger later legs (30 September 2025 and 3 February 2026) carried no company numbers cut at all.
P3b — capitulation: met, unanimous. The deterministic gauge measures sustained volume in the fall leg at 2.24 times the 180-day pre-peak median, clearing the 2x reference line. The counter-fact: 2.24x is well short of the three-to-five-times flood of a single climactic washout, and the two heaviest windows sit about eight months apart — episodic selling rather than one exhaustion point. Full treatment in Dislocation.
P3c — yield versus the bar: not met, unanimous, position 437 bps below. The balance sheet is net cash — $866.5M of cash and short-term investments plus $208.4M of long-term investments, no funded debt [12] — which selects the most generous reference band available, 8–9%. FY2026 adjusted free cash flow of $406.2M on a $9,836.9M market cap is a 4.13% yield; the three-year average is 2.99%. The counter-fact in the same breath: reported free cash flow of $1,058.6M yields 10.76% and clears the 10% default bar outright — the entire difference is the $622.3M of stock-based compensation the adjusted basis removes [9].
P3d — forward path: not met, probability 0.34 with a spread of 0.04, unanimous.
Adjusted-implied path = consensus reported FCF (FY2027 $1,133.0M, FY2028 $1,232.9M, FY2029 $1,328.0M) less stock-based compensation assumed at 17%, 15% and 12% of consensus revenue, less about $30M of normalized acquisition spend, divided by the $9,836.9M market cap. The SBC assumption is a modeled scenario — consensus publishes no SBC-adjusted free cash flow. Bar = the 8.5% mid-point of the fortress band.
The path reaches the fortress band only around FY2029, and only if compensation compresses from about 19% to 12% of revenue. The counter-fact is that the mechanism is already running: stock compensation fell to 17% of revenue in Q1 FY2027 from 19%, and diluted weighted-average shares fell 8% year over year to 196.5M [13]. Full treatment in Yield.
Balance sheet and self-help — P4a, P4b, P4c
P4a — outlast and allocation headroom: met, unanimous, at probability 0.92. There is no funded debt, about $1.07B of cash and investments, and a $750M revolving facility undrawn and covenant-compliant to May 2030 [12]. No principal falls due in any year, so nothing forces capital allocation toward debt paydown at the moment repurchases would matter most. The counter-fact: the same cash flow is heavily consumed by $622.3M of annual stock compensation, so the surplus available for genuine share shrinkage is far smaller than headline free cash flow implies.
P4b — repurchase engine: not met, unanimous. The hard fail keys on the deterministic
share_count_trend.rising = true, a five-year weighted share-count CAGR of +2.4%. Executed
repurchases are real and scaling — $1.76B across FY2023–FY2026, of which $869.1M in FY2026
[9],
plus a record $318M in Q1 FY2027 against a remaining $2.4B authorization
[13].
The skeptic pass weakened the claim to exactly this reading: recent dilution-offset and
turning-point evidence, not a clean engine. The arithmetic that decides it: FY2026 buybacks
of $869.1M against $622.3M of compensation is 1.40x, so net repurchase beyond the dilution
offset is roughly $246.8M. On the framework's absurdity check, retiring the entire float
takes 9.3 years of reported free cash flow or about 24 years of adjusted free cash flow —
distant from the roughly three years that marks a price making a claim it cannot support.
P4c — dividend cover: not applicable. No dividend has been declared and none is expected [7], so the return case rests on repurchases alone. Full treatment in Self-Help.
Diagnosis — P5
Contested at p_temporary = 0.63 with a spread of 0.26. All four jury seats recorded the criterion as contested, carrying the adversarial trial's ruling rather than re-eliciting it. The two readings and the split are set out in the contested section below.
The arithmetic that frames it: enterprise value fell about 59%, from roughly $21.4B to roughly $8.8B, while the near-term numbers barely moved — FY2026 revenue and EPS both beat the consensus that stood before the trigger. On reported free cash flow and a +4% perpetuity that leaves a gap of roughly $10B between price and value. The counter-fact, in the same treatment and on the basis the framework actually uses: on full adjusted free cash flow of about $406M (about $436M before acquisition normalization) the +4% perpetuity value is about $6.8–7.3B, below the current enterprise value of about $8.8B — so the gap is absent on Ruchir's own owner-earnings basis. Full treatment in Damage Math.
Instrument context — I1
Not verifiable, unanimous. Listed options with expiries of twelve months or more are plausible for a standard-cycle Nasdaq name, and dated implied volatility of 53.9% at 30 days and 56.3% at 180 days (as of 2026-07-23) would sit at the top of the acceptable band and just into the elevated zone. Aggregate open interest at the longest tenors could not be confirmed to any dated corpus source, and the skeptic pass marked the whole instrument claim unverifiable — so the facts are recorded as unconfirmed rather than as evidence. I1 never blocks a pillar result, and because the framework's watchlist-only overlay applies only to a fits or lean-fit outcome, that flag is not set here. Context in Clock.
What a 3x-in-3-years would require
The tally's re-rating arithmetic is unavailable: Re-rating math unavailable because the applicable bar or normalized adjusted FCF is missing. Stock-based compensation is
absent from the structured cash-flow feed, so fit_features.adjusted_fcf,
adjusted_fcf_yield and yield_baseline are all not_computable, and the deterministic price
at bar-yield could not be computed.
What the framework's own test requires is still statable as arithmetic. To put the adjusted yield at 8% on today's $9,836.9M market cap, adjusted free cash flow has to be about $787M against $406.2M in FY2026 — close to a doubling. Consensus does not concede that: consensus reported free cash flow of $1,133.0M in FY2027 rising to $1,328.0M in FY2029 produces an adjusted-implied yield of about 8.3% only in FY2029, and only if compensation falls to about 12% of revenue. The concession consensus would have to make is not to the cash-flow line but to the compensation line beneath it.
The base rates come from this name's own price history (Clock): the 2018 episode fell 44.9% over 82 days and round-tripped 350 days from the trough; the 2023 episode fell 43.2% over 267 days and round-tripped in 348 days; the 2021–22 episode fell 87.2% over 432 days and has never recovered its peak. The current episode is 61.0% deep, 444 days from peak to trough, and 12.7% off the low. Two of three comparable episodes recovered inside roughly a year; the deepest did not recover at all.
Contested and undetermined
P5 is contested. The trial produced two cited briefs, read by three independent judges in alternating order.
The temporary reading (judges at 0.68 and 0.63): through the drawdown window earning power grew rather than fell. FY2026 revenue was $3.2B, up 8%; ARR grew 8%; billings reached $3.4B, up 10%, with fourth-quarter billings above $1B for the first time in the company's history; and it was the first year of free cash flow above $1B [5]. The triggering billings miss was a disclosed early-renewal timing artifact that reversed inside the same fiscal year [11].
The permanent reading (judge at 0.42): the expansion engine reset durably and has stayed reset. Dollar net retention fell from 119–123% in FY2021–FY2022 to about 102% and has not returned; revenue growth compressed from 45.0% to 8.2%; remaining performance obligations stalled at $2.4B; FY2027 ARR is guided to only 8.25–8.75% growth [13]; and the AI-replication risk is verified verbatim in the current quarterly filing [14].
The split: judges at 0.68, 0.42 and 0.63; mean 0.577; the tally's trimmed figure 0.63; spread 0.26. Reading order moved the panel — the temporary-first mean was 0.68 against a permanent-first mean of 0.525, a gap of 0.155. That order sensitivity, together with the 0.26 spread, is why the result is recorded as contested rather than decided, and it is what drives the confidence tier to low.
Undetermined. One criterion is unresolved rather than contested: I1, where the named missing datapoint is a dated corpus options-chain and open-interest source (with an implied volatility surface) at the longest tenors. No criterion was returned as cannot-determine.
Provenance
Source: the run's deterministic fit tally, provenance block, and the skeptic refutation ledger.
Two independent model families voted the checklist blind to the reader's framework, and a fifth seat voted the same docket with the company name masked to test whether the result was being driven by prior knowledge of Docusign rather than by the evidence; it returned the same gate results with no probability divergence. Separately, every verdict-critical claim was re-derived from its cited pages by a skeptic — none was refuted, seven were narrowed (most consequentially, the buyback claim was cut back from a working repurchase engine to turning-point evidence, and the perpetuity gap was cut back to nothing on the adjusted basis), and one, the options-market evidence, could not be verified at all.
The falsifier ledger
Fifteen conditions stand as the what-would-change-this ledger, each reproduced as the tally records it, with its window where the text defines one and the direction it points.
The framework's own templates. These are the standing conditions the reader's system carries into every name.
- Cash flow. adjusted FCF or EBITDA declines where flat-or-better was underwritten — no window defined; standing. Direction: cuts against fit.
- Revenue. revenue declines for a third consecutive year — three consecutive fiscal years, rolling. Direction: cuts against fit.
- Allocation. capital allocation pivots to debt paydown over repurchases — no window defined; standing. Direction: cuts against fit.
- Share count. share count inflects upward — no window defined; standing. Direction: cuts against fit.
- Sector. the industry repricing cycle fails to materialize where industry-wide mean reversion was underwritten — no window defined; standing. Direction: cuts against fit.
The trial's flip conditions. These are the name-specific tripwires the panel wrote for the diagnosis (P5) — three from the first judge, three from the second, four from the third, carried into the tally as written.
- Consumption/envelopes-sent turn negative YoY or DNR breaks below 101% in FY2027 — the first observable signature of AI substitution actually impairing the eSignature base. (FY2027. Direction: cuts against fit.)
- FY2027 FCF falls below ~$1.0B or buybacks drop well below ~70% of FCF — the per-share compounding that carries the 8x valuation stops. (FY2027. Direction: cuts against fit.)
- IAM ARR growth stalls (fails to reach the guided ~18%) while total ARR decelerates below 8% — the replacement engine proves to be eSignature migration, not incremental demand. (no window stated. Direction: cuts against fit.)
- By Q4 FY2027, total ARR grows at least 11% organically, DNR exits above 108%, and revenue growth exceeds 10% excluding FX. (by Q4 FY2027. Direction: supports fit.)
- By FY2028, IAM exceeds 25% of ARR while total company ARR and RPO accelerate, showing IAM is incremental rather than mainly migrated eSignature dollars. (by FY2028. Direction: supports fit.)
- Management discloses large IAM renewal cohorts with materially above-company gross retention and DNR, replacing the current small-sample evidence. (no window stated. Direction: supports fit.)
- DNR breaks below 100% or consumption/envelopes-sent turn negative YoY — signals genuine AI substitution rather than timing, → permanent (no window stated. Direction: cuts against fit — the tally marks this one permanent.)
- FY2027 FCF falls below ~$1.0B or forward FCF consensus begins to be cut — absolute earning power actually eroding, → permanent (FY2027. Direction: cuts against fit — the tally marks this one permanent.)
- IAM fails to reach guided ~18% ARR and total ARR growth slips below 8% — growth engine fading not stabilizing (no window stated. Direction: cuts against fit.)
- IAM exceeds 25% of ARR with total ARR/RPO accelerating — confirms incremental, not migration, → strongly temporary (no window stated. Direction: supports fit — the tally marks this one strongly temporary.)
Data gaps
- Stock-based compensation is absent from
data/financials/cash_flow.jsonfor FY2017–FY2026, sofit_features.adjusted_fcf,adjusted_fcf_yield,yield_baseline,fcf_stabilityandfloat_retirement_yearsare all not_computable. Every adjusted-FCF figure on this page is an analyst derivation from the filed cash-flow statements (FY2026 p.106, FY2024 p.107, FY2022 p.112), not the deterministic feature; the feed should be repaired to ingest the SBC and acquisitions lines. fit_features.balance_sheet_classreads 'unknown' (debt and cash flagged missing for FY2026); the fortress classification here is derived from the filed balance sheet (p.102) and liquidity note (p.86), which show no funded debt and about $1.07B of cash and investments.fit_features.market_capuses $10B as the reference; the exact break-even share price (about $47.8) is derived from feature inputs and is not stated in any filing.- No company-reported e-signature market share exists. Only methodology-dependent third-party estimates (roughly one-third to two-thirds for Docusign) are available, so the P1 share evidence cannot be pinned to a filed primary source and is directional only.
- The year-10 dollar impact of AI substitution cannot be quantified from the corpus; it is bounded here by the exposed share of ARR (roughly 80% legacy) rather than a point estimate.
- Consensus publishes no SBC-adjusted free cash flow. The adjusted forward path uses assumed compensation of 17%, 15% and 12% of revenue for FY2027–FY2029 — a modeled scenario, not a vendor figure.
- CapIQ estimate-revision momentum reaches back only 180 days (to 2026-01-24), so the vendor record cannot show the consensus reaction in the days immediately after the June 2025 trigger.
- The two AI-driven de-rating legs (30 September 2025 and 3 February 2026) have no corresponding corpus filing. The run's web-research budget was exhausted, so attribution rests on harness web search plus the daily price feed.
balance_sheet.jsonexposes only cash and equivalents ($602.4M at FY2026), not short-term or long-term investments or debt, so the net cash used for enterprise value was taken from the Q1 FY2027 quarterly liquidity note ($814.2M cash and short-term investments plus $209.9M long-term investments, no debt).- Reported short interest, days-to-cover and borrow pressure are unavailable for DOCU (the feed returned no position rows), so the crowded-short and forced-buyer channel cannot be assessed.
- Aggregate and long-dated (18-month) option open interest could not be confirmed to a single dated citable source; only the 30-day and 180-day mean implied-volatility points are dated (2026-07-23).
- Exact future earnings dates for Q2–Q4 FY2027 are inferred from the reporting cadence (Q4 FY2026 reported 2026-03-17; Q1 FY2027 reported 2026-06-04), not from a published calendar.
- The absence of open-market insider purchases and the net-seller pattern come from structured Form 4 data rather than a citable filing PDF; the ownership levels are cited to the proxy.
share_count_trend.cagr_10y_pctis not_computable — share counts exactly ten fiscal years apart are unavailable.- P4c (dividend cover) is not_applicable: Docusign pays no dividend.
Business
Docusign sells subscription software that lets organizations sign and manage agreements electronically — one reportable segment, $3.22B of FY2026 revenue (98% subscription), 1.8 million customers, incorporated 2003 and IPO'd 2018 on Nasdaq. It clears the auto-OEM and China screens cleanly and does not screen as a consensus darling (it trades near 3x sales and is down 61% from its 2024 peak). Two facts a reader should carry forward: the market capitalization sits just under the framework's $10B universe line, and the competitive structure is fragmented and low-barrier — the raw material the Durability tab will weigh.
What Docusign is, in two sentences
Docusign is a US software company that sells subscriptions to an electronic-signature service — "the world's leading e-signature solution," in its own words — and a wider Intelligent Agreement Management ("IAM") platform for creating, signing, storing and analyzing contracts [1]. Roughly 1.8 million customers in over 180 countries pay recurring fees — 98% of FY2026 revenue was subscription — with no customer above 10% of revenue [2].
The business is a single operating and reportable segment; management reports to the CEO on a consolidated basis and breaks out only geography [3]. So there are no divisional economics to reconcile — the economics are the whole company.
Source: FY2026 Form 10-K, Consolidated Statements of Operations and Note 16 [4]; revenue history from reported financials.
Revenue grew fast and then decelerated hard: from 49% year-over-year in FY2021 to 9.8% in FY2024 and roughly 8% since. Operating income only crossed into GAAP profit in FY2024 after years of losses, and FY2025's $1.07B net income was flattened by a one-time $820M tax-valuation-allowance release, not operations — GAAP operating margin was 9.3% in FY2026 [5]. The maturation from hyper-growth to high-single-digit growth is the backdrop to everything the other tabs examine; the Yield and Self-Help tabs carry the cash economics.
How it makes money and how scaled it is
Revenue (FY2026)
ARR (Jan 2026)
Customers
Employees
Source: FY2026 Form 10-K — Overview (customers, ARR) [6]; Human Capital (employees) [7]; Note 16 (revenue) [8].
The model is recurring subscription: customers buy one-to-three-year contracts, and substantially all multi-year customers pay a year in advance, which is why annual recurring revenue ($3,272M at January 2026, up from $3,030M) and billings ($3,406M in FY2026) run close to reported revenue [9]. Gross margin is high — 79.4% GAAP in FY2026 — the signature of a software business that ships bits, not atoms [10]. Docusign employed 7,044 people at January 2026, about 60% in the US [11].
The newer IAM platform — the growth story management is selling — was only 10.8% of ARR at January 2026 (up from 2.3% a year earlier); standalone eSignature is still expected to be the majority of revenue "for the foreseeable future" [12]. So the company today is, overwhelmingly, an e-signature business.
Where the revenue and assets sit
Source: FY2026 Form 10-K, Note 16 Segment and Geographic Information [13].
The US is 71% of revenue ($2.27B of $3.22B); international is 29% and rising slowly (28% in FY2025, 26% in FY2024), with no single country outside the US above 10% [14]. Long-lived assets are similarly domestic — $438.7M in the US against $89.9M in all other countries combined [15]. Docusign has offices in 12 countries [16].
The universe screen
Market capitalization is approximately $9.8B — below the framework's greater-than-$10B universe line. The listing screen (US primary listing, not a Chinese ADR) is clean; the size screen is a marginal miss.
Listing and instrument (U1). Docusign, Inc. is a Delaware-incorporated US company whose common stock has traded on the Nasdaq Global Select Market under "DOCU" since its May 2018 IPO at $29.00 a share [17]. It is a US-listed common stock, not a European ADR and not a Chinese company or Chinese ADR — the geography screen passes without qualification.
Market cap versus the $10B line (U2). The deterministic feature computes market capitalization at $9.837B — the July 23, 2026 close of $47.04 times 209.1 million shares outstanding — which is below the framework's greater-than-$10B universe line. Independent market-cap trackers put Docusign in the $8.6–9.0B range across July 2026, i.e. the same conclusion from a different source. This is a universe miss, but a razor-thin one: the cap sits only about 1.6% under the line, which a $47.82 share price (up from $47.04) would clear. On some July trackers' lower figures the gap is wider, but on the deterministic feature the miss is marginal. It is stated here plainly; the Fit tab leads with it.
Market-cap figures: fit_features.market_cap.usd (price $47.04 × 209,118,000 shares, 2026-07-23); shares outstanding per the FY2026 balance sheet. Current-listing and independent market-cap facts from public market data, July 2026.
First-pass exclusion screen
Auto-OEM (X1) — clean pass
Docusign is a prepackaged-software company; it designs, builds and hosts cloud software and generates 98% of revenue from software subscriptions [18]. It is not an automobile or auto-parts manufacturer and has no OEM exposure. The exclusion does not apply.
China dependence (S1) — absent
There is no material China exposure to quantify. Across five annual reports (FY2022–FY2026) the word "China" does not appear once, and geographic disclosure shows no single country outside the US above 10% of revenue, with international assets of $89.9M spread across all non-US jurisdictions combined [19][20]. International revenue is 29% of the total, concentrated in English-speaking common-law countries and the EU [21]. The China sensitivity flag is not raised.
Consensus-darling positioning (X4) — does not screen as a darling now
On the three tests the corpus can settle, Docusign does not currently look like a story consensus has piled into.
Source: derived — market caps from close prices × shares outstanding (2026-07-23); revenue from each company's latest reported fiscal year. Peer set is the e-signature competitor group named in Docusign's own 10-K [22].
Multiple-to-sales. Docusign trades at about 3.1x trailing revenue — the low end of its listed e-signature peer group, and a fraction of the 15–20x sales it commanded near its 2021 peak. That is not the extreme multiple-to-sales the exclusion targets.
Coverage tone. The sell side is cautious, not enamored: consensus sits at a "Hold," and in April 2026 Citi downgraded Docusign to Neutral and cut its target to $50 on concerns that AI could commoditize e-signature — targets have been trimmed broadly since. That is the opposite of a story everyone owns.
Chart shape. Docusign is down about 61% from its December 2024 peak of $106.99 to a February 2026 trough near $41.75, currently $47.04 — a top-left-to-bottom-right descent, not the bottom-left-to-top-right darling chart [23]. Over five fiscal years the 10-K's own performance graph shows the stock down to roughly 25% of its January 2021 value while the S&P 500 IT index more than doubled [24].
The X4 conclusion: Docusign was a pandemic darling that has already de-rated; on today's evidence it does not screen as a consensus-saturated name. The drawdown and who-was-selling questions belong to Dislocation.
Coverage-tone and peer market-cap facts from public market data and analyst commentary, July 2026; drawdown depths from fit_features.capitulation_gauge.
Market structure — the P1 raw material
This is the evidence the Durability tab and the jury lean on, so it is laid out in full and to the page. Ruchir's year-10 conviction is built from market structure, regulatory entry barriers, capital intensity, essentiality and operating history. Docusign's readings on each:
Structure: fragmented and low-barrier, with one large adjacent giant. Docusign names exactly one primary competitor — Adobe, via Acrobat Sign — and then a long, open-ended list: "other global software companies that have or may elect to include basic electronic signature capability in their products," vendors focused on specific industries or geographies, and, increasingly, "providers of LLMs, data platform companies and other enterprise software companies, and … homegrown solutions developed internally by customers" [25]. This is not a monopoly, duopoly or protected oligopoly; it is a category any capable software vendor can enter and several have.
Sources: Docusign FY2026 10-K, Our Competition [26]; Adobe FY2024 10-K, Document Cloud [27]; OneSpan FY2025 10-K, Competition [28]; Box FY2026 10-K, Competition [29]; Dropbox FY2024 10-K [30].
The peers corroborate the structure rather than contradict it. OneSpan, a listed pure-play, describes its e-signature competitors as "Docusign and Adobe Systems," both "significantly larger than us," plus "numerous smaller and regional or niche providers" [31]. Box and Dropbox each bundle e-signature (Box Sign, Dropbox Sign) into broader content platforms — Box calls the content-management market "large, highly competitive and highly fragmented" and now competes "in the e-signature … market" [32]. Docusign is the share leader (third-party trackers variously put it at roughly a third to two-thirds of the e-signature market depending on methodology), but it leads a contested, splintering field, not a fortress. Market-share estimates from third-party market research, July 2026, methodology-dependent and not company-reported.
Market position (share leader) — the counter-fact. The fair counter to "fragmented and low-barrier" is that Docusign is the entrenched category leader with 1.8 million customers, a billion users, a trusted brand, 1,100+ partner integrations and switching-cost stickiness from being the system of record for agreements [33]. Whether that leadership is a durable moat or an execution lead that AI can erode is precisely the temporary-or-permanent question the Durability tab adjudicates; this tab records both sides.
Regulatory entry barriers: enabling, not protective. The laws that matter here — the US ESIGN Act and state-level UETA, the EU's eIDAS regime — authorize electronic signatures and give them legal force; they do not license or gate who may offer e-signature software [34]. Docusign holds real certifications — FedRAMP and GovRAMP authorization, EU Trust Service Provider status through Docusign France — that are competitive assets and raise the bar for the government and regulated slice of the market [35]. But these are earnable credentials, not a regulator standing between incumbents and new entrants. This is not the banks-and-insurers barrier Ruchir's framework prizes.
Capital intensity: low. Docusign spends little to grow. Capital expenditure was $106.4M in FY2026 — 3.3% of revenue — and total long-lived assets are $528.6M against $3.22B of revenue [36][37]. Capital-light is excellent for cash conversion — the Yield tab's subject — but it is the opposite of the capital-heavy essentiality ("capital-heavy essentials survive the AI world") that the framework treats as a moat. Low capital intensity means a well-funded rival needs capital, not a fab or a branch network, to compete.
Essentiality and operating history. E-signature is useful and embedded in customer workflows — 99.9%+ availability, a billion users — but it is a productivity tool, not an essential utility, and management flags directly that AI advances make "some foundational capabilities for agreements … cheaper and easier to replicate" [38]. Docusign has operated since 2003 — 23 years — and been public since 2018 [39]. That is a real track record, but short of the 30–50-year histories the framework leans on, and the company's decisive scale arrived only in the last decade.
Market-structure summary (facts for the Durability tab, not a verdict): fragmented, low-barrier category; one primary competitor (Adobe) plus content-cloud bundlers and, on management's own account, LLM providers and homegrown tools; regulation that enables e-signature broadly rather than protecting incumbents; low capital intensity (capex 3.3% of revenue); a useful-but-replicable product; 23-year operating history. Docusign is the share leader in that category. The AI-commoditization risk is management's own top-listed risk factor.
Docusign itself frames AI as the central threat: the first-listed Business and Industry risk in the FY2026 10-K is that "rapid and unpredictable advances in AI … could reduce demand for our solutions, disrupt our business and strategy, and cause competitive and financial harm" [40]. It also concedes it may have "overestimated our market opportunity," which would cap the growth runway [41]. Whether AI commoditizes the core signature or Docusign's IAM platform turns that same AI into a durable advantage is the load-bearing debate the Durability and Damage Math tabs resolve.
Dislocation
DocuSign fell 61.0% from a $106.99 close on December 6, 2024 to a $41.75 trough on February 23, 2026, and trades at $47.04, down 56% from the peak. The fall has a dated event leg — the June 5, 2025 billings-guidance cut, a −19% day on 8.9× volume — and two later legs driven by AI-disruption fear, not a numbers cut. The distinguishing fact: consensus estimates and reported free cash flow rose through the decline. The trigger is real and the panic days were real; the near-term earnings power was not cut.
The drawdown, quantified
Peak close (Dec 6, 2024)
Trough close (Feb 23, 2026)
Current (Jul 23, 2026)
Peak-to-trough decline
Peak-to-trough (calendar days)
Source: drawdown figures from fit_features.capitulation_gauge.drawdown (derived from data/prices/daily.json); peak-day context from the Q3 FY2025 results release [1].
The peak itself was an event: the $106.99 close on December 6, 2024 came after a +27.9% single-day jump on the December 5 Q3 FY2025 report, where management said "early IAM momentum outpaced expectations" and cited "strong revenue growth and operating profit" [2]. From there the stock did not fall in one motion. It gave back roughly 13% over the next six months on ordinary volume — drift, not an event — then fell in three distinct legs.
Source: month-end closes from data/prices/daily.json; intramonth peak of $106.99 (Dec 6, 2024) and trough of $41.75 (Feb 23, 2026) per fit_features.capitulation_gauge.drawdown.
The legs — separating drift from events
Three dated adverse events account for the decline; a fourth stretch is drift with no catalyst. The event leg the framework cares about is the first: a guidance cut married to a capitulation-volume day.
Source: leg dates and prices from data/prices/daily.json; the guidance cut from the Q1 FY2026 results release and call [3] [4]; the AI-competition and sector-selloff triggers from contemporaneous financial press.
The event leg (P3a): the June 2025 guidance cut
The single clean, dated adverse event is the Q1 FY2026 report on June 5, 2025. The company trimmed its full-year billings guidance midpoint by $15 million — from a $3,300–$3,354 million range set in March to $3,285–$3,339 million — "which includes additional early renewal considerations and some conservatism in our bookings outlook" [5] [6]. The cause was a self-inflicted go-to-market change: new sales-rep compensation designed to discourage early renewals took hold sooner than forecast, so early-renewal billings came in light. Management said the impact "began sooner than forecasted" and "take[s] responsibility for underestimating the potential timing and range of impact" [7]. The company was explicit that early-renewal timing "has a negligible impact on revenue," and it raised full-year revenue guidance by $22 million the same day [8].
The market reaction was severe out of proportion to the $15 million (roughly 0.4%) billings trim: the stock fell 19.0% on June 6, 2025 — from $92.90 to $75.28 — on 22.6 million shares, 8.9× the trailing 50-day average and the largest single-day volume of the entire decline (data/prices/daily.json; data/tech/unusual_volume.json). This is the framework's canonical shape: a modest near-term cut met with a violent, high-volume repricing.
The later legs: fear about the terminal value, not the numbers
The two subsequent legs were not company events. On September 30, 2025 — with no DocuSign release; the Q2 report on September 4 had beaten — the stock fell 12.2% on 9.7 million shares after a leading AI lab unveiled a contract-data agent, sparking a competition scare against the agreement-management franchise. Then across January–February 2026 the stock ground from ~$70 to the $41.75 trough, with an 11.4% drop on February 3, 2026, as an AI-agent automation platform launch triggered a sector-wide software selloff (the press-named "SaaSpocalypse") built on fear that agentic AI compresses per-seat SaaS licensing. These legs repriced the long-term story, not a quantified earnings hit — a distinction the Damage Math tab and the trial take up.
The fear gauge (P3b): panic in bursts, not one capitulation
The deterministic capitulation gauge measures the highest 20-day average volume during the fall against the median daily volume in the 180 days before the peak. That multiple is 2.24× (fit_features.capitulation_gauge.volume_spike). On a sustained basis that is a moderate elevation, not the 3–5×+ flood of a single climactic capitulation. The elevated 20-day windows sit at the end of June 2025 (the guidance-cut leg) and are essentially matched again in February 2026 (the trough).
Source: derived from data/prices/daily.json; pre-peak median daily volume ≈ 2.23M shares (180 trading days before Dec 6, 2024). A value of 1.0× equals the pre-peak norm.
The picture is emotion-driven selling arriving in discrete event bursts across 14 months rather than one exhaustive capitulation. The single worst day — June 6, 2025 at 8.9× the 50-day average — was the guidance-cut reaction; the trough month of February 2026 carried the highest sustained volume (2.76× the pre-peak median), including an 18.0-million-share session on February 27, 2026. There was a spike, and it was measurably large on event days; but the fall did not concentrate into the one washout the pattern's cleanest form would show.
Who was selling
The evidence on seller composition is partial, and the most important channel is missing. Reported short interest is unavailable in this run — the exchange feed returned no position rows for DOCU (data/short_interest/latest.json, status "unavailable") — so short-covering pressure and its change cannot be measured here.
What the record does show:
- No insider buying into the fall. Corporate insiders made zero open-market purchases across the decline (and none since 2023) — no one with inside knowledge stepped in at $42–$47.
- The one large insider sale sat near the top, from a departed executive. Former CEO Daniel Springer sold roughly $56 million on December 10, 2024 at $95.70–$100.66 — days after the peak. Current officers' 2026 open-market sales are small (roughly $1–2 million combined, at $42–$46) and consistent with routine, scheduled disposition rather than conviction selling.
- No disclosed forced or structural seller. The data show no activist 13D, no index-deletion event, and no fund liquidation. The holder base is dominated by passive index managers (Vanguard, BlackRock, T. Rowe Price, JPMorgan).
- The company was the largest identifiable buyer. DocuSign repurchased $683.5 million of stock in FY2025 and $869.1 million in FY2026 [9], and added $2.0 billion to its authorization in March 2026 [10].
On the available evidence, the selling reads as broad institutional and retail de-rating on the AI narrative rather than an identifiable forced or anchored seller being flushed. The absence of reported short-interest data is a genuine gap the Self-Help tab's capital-allocation read partly offsets.
Estimates vs price: the fall did not outrun an estimate cut
The framework's signature is a price fall that outruns the estimate cut. DocuSign shows the opposite polarity: the price fell ~61% while consensus estimates and reported cash flow rose.
Source: price from data/prices/daily.json; reported FCF from fit_features.adjusted_fcf.series (data/financials/cash_flow.json); consensus FCF, revenue, and EPS from fit_features.consensus_forward_yield and estimate momentum (data/sp/estimates.json).
Reported free cash flow climbed every year through the drawdown — $887 million (FY2024), $920 million (FY2025), $1,059 million (FY2026) (fit_features.adjusted_fcf.series, from data/financials/cash_flow.json), with FY2026 a record on management's own account [11]. Forward consensus rose in step: FY2026 FCF of $990 million (10.1% of the current market cap), FY2027 $1,133 million (11.5%), FY2028 $1,233 million (12.5%). Consensus FY2027 EPS was marked up from $4.11 in January 2026 to $4.53 by July 2026, and every quarter through the decline beat consensus EPS by 3–20% and revenue by 1–3%.
The only downward revision in the whole window was the company's own $15 million (≈0.4%) FY2026 billings-guidance trim in June 2025 — set against a ~30% price move that quarter and a same-day $22 million increase to revenue guidance [12]. The de-rating was a compression of the multiple on the long-term AI-disruption narrative, not a markdown of the near-term numbers. This is the reverse of the Centene template, where a two-thirds EPS cut drove a two-thirds price fall. Here the price fell without a comparable cut to earnings power.
Peer context: the AI-exposed names fell hardest
The subsector split matches an AI-narrative de-rating. DocuSign and Adobe — the two names most directly framed as AI-signature/agreement disruption targets — fell hardest and stayed down; storage and content peers fell far less and largely recovered.
Source: derived from data/prices/daily.json (DOCU) and each peer's price file under parsed/competitors/; all changes anchored to each name's close on Dec 6, 2024.
Bottom line
There is a dislocation: a 61.0% peak-to-trough drawdown with dated, identifiable triggers and genuine event-driven panic days. Its anatomy is atypical for the framework. The clean event leg — the June 2025 billings-guidance cut on 8.9× volume — was a modest ~0.4% cut met with a 19% day. The two larger legs were AI-disruption fear (a competitor's contract-agent launch; a sector-wide "seat-compression" selloff) that repriced the terminal value, not the near-term numbers. The sustained capitulation multiple is moderate at 2.24×, and — the decisive fact for this tab — the price fell ~61% while consensus estimates and reported free cash flow rose. Whether that de-rating is deserved is not this tab's question; that belongs to the Damage Math tab and the trial.
Damage Math
DocuSign's drawdown took roughly $12.5B of enterprise value out of the stock — a 59% cut — while the near-term earnings line barely moved. FY2026 revenue and EPS beat the consensus that stood before the trigger, forward FCF and EPS estimates rose, and full-year revenue guidance was raised on the very quarter the stock fell 19%. With the numerator near zero, the entire re-rating is a judgment on long-run earning power under AI. Whether that judgment is right is the trial's question, ruled temporary at 0.63 — contested, judges spanning 0.42 to 0.68.
The numerator: how far the near-term numbers actually fell
The framework's canonical setup is Centene — consensus EPS cut roughly two-thirds, the stock down two-thirds. DocuSign is the opposite arithmetic. The triggering event, the 5 June 2025 first-quarter print, missed on one metric only: billings grew 4% to $740M, "slightly below our guidance range due to lower-than-expected early renewals," a change management attributed to its own sales-compensation redesign and called of "negligible impact on revenue" [1]. The stock fell 19.0% the next day. The profit-and-loss guidance went the other way: management raised full-year FY2026 revenue guidance to $3.151–3.163B from the $3.129–3.141B set in March, while trimming the billings midpoint about $15M for renewal timing [2] [3].
Sources: consensus levels from CapIQ estimates, vintage 2026-07-23 (data/sp/estimates.json, n=22–23 analysts); guidance change from the Q1 FY2026 and Q4 FY2025 earnings calls [4] [5].
Not one quarter of the drawdown carried a consensus cut. Every quarter from the trigger forward beat, and the beats were largest on the bottom line.
Note: the 1Q26 print (5 Jun 2025) also beat — revenue +2.0%, EPS +10.5% — the miss was billings, a forward-timing metric not in this consensus. Source: CapIQ actual-vs-consensus surprise history (data/sp/estimates.json, beat_miss).
Forward estimates did not just hold — they climbed, including straight through the February 2026 AI-driven selloff. Consensus FY2027 EPS rose 10.0% and FY2028 EPS rose 12.4% over the trailing six months; forward FCF consensus rises every year through FY2029.
Source: CapIQ estimate momentum, as-of dates 2026-01-24, 2026-04-24, 2026-07-23 (data/sp/estimates.json, momentum). Vintages begin after the June-2025 trigger; the pre-trigger anchor is the quarter-by-quarter beat record above.
The near-term hit to revenue, EPS, and FCF is, on the record, approximately zero — and if anything positive. That is the numerator of the whole tab, and it is empty.
The denominator: what the price took out
Against a numerator of zero, the price took out more than half the company. From the $106.99 peak of 6 December 2024 to $47.04 on 23 July 2026, the shares fell 56.0%; at the 23 February 2026 trough of $41.75 the decline was 61.0%.
Enterprise value, peak → now
Enterprise value now ($B)
Enterprise value at peak ($B)
Enterprise value = market cap − net cash. Market cap at peak ≈ $106.99 × 210.3M shares = $22.50B, less ~$1.15B net cash. Current market cap $9.84B (fit_features.market_cap, price 2026-07-23), less $1.02B net cash — $814.2M cash and short-term investments plus $209.9M long-term investments, no debt [6]. Peak/trough prices from fit_features.capitulation_gauge.
Stated side by side: consensus FY2026 EPS ended 1.6% higher than the pre-trigger consensus, and the market cap fell 56.3%. The earnings the market can see did not fall; the price it will pay for them did. Enterprise value shed roughly $12.5B while free cash flow rose from $920.3M (FY2025) to $1,058.6M (FY2026) [7]. The current enterprise value is 8.3× realized FY2026 free cash flow and 7.8× the $1,133M consensus expects for FY2027.
The NPV arithmetic, conservatively
Because the near-term line did not move, none of the $12.5B can be a discounted-cash haircut on the next year or two. All of it is a change in the assumed terminal earning power. A transparent perpetuity test isolates exactly how much long-run change the price is claiming.
The workings are deliberately simple and visible. Value of a growing perpetuity is V = FCF₁ / (r − g), discount rate r = 10% (a profitable, no-debt software business; the sensitivity to r is modest and noted below). Two free-cash bases are shown, because the framework and the market disagree on which one is real:
Reported FCF ≈ $1,133M — the consensus forward figure the sell side and the 8× multiple use.
Adjusted FCF ≈ $437M — reported FY2026 FCF of $1,058.6M less $622.3M of stock-based compensation [8]. This is closer to the owner-earnings basis the framework insists on; the full adjusted-yield computation is owned by the Yield tab.
Derived: V = FCF₁ / (r − g), r = 10%. Reproducible from the two FCF bases above. Current enterprise value ≈ $8.8B; peak ≈ $21.4B. At r = 9% every reported-FCF figure rises ~15–25% and at r = 11% falls a similar amount; the ordering versus current EV is unchanged.
The grid reads two ways, and the honest answer is that it depends on which column you trust:
On reported free cash flow, the current $8.8B enterprise value corresponds to a terminal growth rate of roughly −3.5% — the market has already priced a permanently declining annuity. The peak $21.4B priced roughly +5.5% terminal growth. The re-rating is a ~9-point reset of the long-run growth assumption.
On adjusted free cash flow, the current $8.8B enterprise value sits above even the +4% stabilized value ($7.3B). On the framework's own owner-earnings basis, the stock is not obviously cheap even if the business is fine.
The gap, in numbers. If the impairment is temporary — earning power intact, the business stabilizes at a modest +4% terminal on reported cash — fair EV is ~$18.9B against ~$8.8B today: the price destroyed on the order of $10B (≈53%) more value than a temporary reading supports. If the impairment is permanent — AI erodes the base toward a −3.5% terminal — the current $8.8B is roughly fair and the gap closes to about zero. And on the framework's SBC-adjusted basis, the gap is absent under either scenario. So the mispricing Ruchir hunts is present only if both conditions hold: the damage is temporary and one values on reported rather than adjusted cash. The first condition is the trial's; the second the framework decides against. This is not the clean Centene gap, and it should not be dressed as one.
The trial: temporary or permanent
The temporary-versus-permanent question was argued by two opposing, corpus-cited briefs and ruled on by three blind judges. Both cases are strong; neither is a straw man.
The case for temporary
The move is multiple compression, not earnings destruction. The trigger was a timing metric, not a cash flow: early-renewal pull-forward is a working-capital phenomenon that annualizes away in one renewal cycle, and it did — FY2026 billings reached $3.4B, up 10%, with Q4 billings exceeding $1B for the first time in company history and the year producing over $1B of free cash flow for the first time [9]. The company beat the guidance it set before the crisis. Underlying demand is improving, not eroding: Q1 FY2027 dollar net retention was over 102% and rising, consumption reached multi-year highs across most segments, and customers spending over $300,000 grew 12% — the first double-digit reading in that metric in three years [10]. The AI threat is being monetized as distribution, not lost as share: IAM reached 12.6% of ARR, up from 10.8% the prior quarter, across 40,000 companies, guided toward ~18% by year-end, and DocuSign now connects inside the feared platforms via MCP to Claude, Gemini, and ChatGPT [11]. Meanwhile the balance sheet converts the discount now: 32% operating margin, 35% FCF margin, and a $318M buyback — the largest in company history — cut diluted shares 8% year-over-year to 196.5M [12] [13].
The case for permanent
The impairment is a lasting loss of expansion velocity, not a one-quarter miss. Revenue growth reset from 45% in FY2022 to roughly 8% by FY2026, and consensus embeds no snapback — FY2028 revenue growth of only about 7.5%. The land-and-expand engine broke and has not recovered: dollar net retention fell from 119–123% in FY2021–22 to about 102% in FY2025–26, a 17–21 point structural impairment, and management itself said customers were "expanding at a slower rate relative to their peak levels" even before COVID cohorts rolled off [14]. Remaining performance obligations stalled at $2.4B across FY2025 and FY2026. IAM is an attempted replacement engine, still only 12.6% of ARR and explicitly early — management called the enterprise renewal-cohort sample "pretty small" — and it bundles the new signature offer, so its ARR is not purely incremental. The latest filings say eSignature remains the "substantial majority" of revenue [15], and that AI is making core agreement capabilities "cheaper and easier to replicate" by generic LLMs and general-purpose agents [16]. Free cash flow and buybacks lift per-share value, but they do not prove pricing power or expansion power has returned.
The judges ruled the impairment temporary with probability 0.63 — but the ruling is contested: the three seats landed at 0.68, 0.63, and 0.42, a 0.26 spread that straddles the coin toss.
Ruling — P(impairment temporary)
Judge spread (contested)
Source: adversarial-trial ruling (ruchir/trial/tally.json): p_temporary 0.63, three-judge mean 0.577, spread 0.26, contested. Reading order matters — the two temporary-first-mean vs permanent-first-mean readings differ by 0.155, so the diagnosis is order-sensitive as well as split.
The reading is genuinely two-sided and should be carried as such. The one judge who read the permanent brief first and still leaned temporary (0.63) and the one who flipped to permanent (0.42) disagree on the same evidence; the case does not resolve to a clean answer, and rounding it up to one would misrepresent the record. What decides it going forward is observable: dollar net retention breaking below 100% or consumption turning negative year-over-year would signal genuine AI substitution (permanent); total ARR re-accelerating above 11% organically with IAM crossing 25% of ARR would confirm incremental demand (temporary).
Which line broke, and whether it self-corrects
Three separate lines are tangled in the drawdown, and they self-correct on very different clocks.
Sources: billings reversal [17]; DNR history [18] and Q1 FY2027 [19]; AI risk factors [20] [21]; AI de-rating dates and price moves confirmed via web research, no corpus filing.
The line that actually broke in the numerator — billings — has already self-corrected: it is a working-capital timing swing that reversed within the fiscal year, and management flagged the go-to-market change one quarter before the strongest billings print in company history. The line the market is pricing — terminal earning power — did not appear in any reported number; it entered on two headline AI events (OpenAI's agreement agent on 30 September 2025, −12.2%, and Anthropic's legal tools on 3 February 2026, −11.4%). The repricing mechanism, if temporary, is mechanical: at roughly 8× free cash flow, retiring 8–13% of the share count a year is itself most of the return, and it works while the market waits to see whether DNR and consumption confirm the base is intact. The company concedes the structural risk in its own words — competitors "may incorporate AI into their products more quickly or more successfully than us" [22]. The Durability tab weighs that moat question on the longer clock; here the arithmetic is only this: the price destroyed value the near-term numbers did not, and the gap is real only under a reading of the future the trial rates a contested 0.63.
Yield
On Ruchir's basis — reported free cash flow less stock-based compensation less the five-year average of acquisitions — DocuSign's FY2026 adjusted FCF is about $406M, a 4.1% yield on the ~$9.84B market cap. Reported FCF yields ~10.8%; the gap is $622M of annual SBC, ~19% of revenue. The balance sheet is net cash (fortress), so the reference line is the lowest bar, ~8–9% — and 4.1% sits below it. Consensus forward FCF clears 10%, but only on the unadjusted number that overstates.
The number that makes DocuSign screen cheap — a ~10.8% reported FCF yield — is mostly stock-based compensation. On the SBC-adjusted basis this framework requires, FY2026 yield is 4.1%, and the three-year average is 3.0%. Both sit below even the fortress bar.
A note on the source of these figures
The deterministic feature file marks adjusted FCF, its yield, the yield baseline, the balance-sheet class, and float-retirement years all not_computable — the structured cash-flow feed it reads carries no stock-based-compensation line and no acquisitions line, so it could compute none of them. Those figures are not missing from the record, only from the feed: every component below is lifted directly from the filed 10-K cash-flow statements and cited to the page. The arithmetic here is therefore filing-anchored, not a re-derivation against a feature figure. The pipeline gap is logged in this tab's data gaps.
1. The adjustment, line by line
Adjusted FCF = reported FCF − SBC − trailing 5-fiscal-year average acquisition spend; derived from company filings. Reported FCF and SBC from Consolidated Statements of Cash Flows [1]; earlier-year SBC and acquisitions [2] [3].
The adjustment is dominated by one line. FY2026 reported FCF was $1,058.6M — operating cash of $1,165.0M less $106.4M capex [4]. Stock-based compensation that same year was $622.3M [5], roughly 19% of the $3,219.5M in revenue [6]. Subtracting it removes 59% of reported FCF. The point of Ruchir's basis is exactly this: SBC is a real cost of the business paid in dilution, and a yield that ignores it is not a yield he will underwrite.
The acquisition adjustment is small and shrinking. DocuSign spent $180.4M on acquisitions in FY2021 and $143.6M in FY2025, with near-zero in the intervening and surrounding years [7] [8]. The five-year average runs $30–66M — a rounding item next to SBC. Note the feature feed's implicit-zero rule would have set this to zero; using the filed figures raises the deduction slightly and is the conservative choice.
The trajectory matters. Adjusted FCF was negative or nil in FY2022–FY2023 — SBC ran ahead of cash generation — and turned firmly positive from FY2024 as operating margins expanded and SBC flattened. FY2026's $406.2M is a genuine improvement, not a one-off.
2. The yield, three ways
Reported FCF Yield (FY26)
Adjusted Yield (FY26)
Adjusted Yield (3yr avg)
Fortress Bar
Yields = adjusted FCF ÷ market cap of ~$9.84B (209.1M diluted shares × $47.04 close, 23 Jul 2026). Adjusted FCF derived from filings [9]; market cap per Metrics (fit_features.market_cap). Fortress bar is a framework reference line.
Three cuts, all on today's ~$9.84B market cap:
- Current (FY2026): $406.2M ÷ $9,836.9M = 4.1%.
- Three-year average (FY2024–FY2026): mean adjusted FCF of $294.4M ÷ $9,836.9M = 3.0%.
- Reported, for contrast: FY2026 reported FCF of $1,058.6M yields 10.8% — the number a screen shows.
On whether the current level is a jump from a stable low baseline — the fortress signature Ruchir hunts, a Microsoft 4%→9% on a fear spike — DocuSign does not fit the shape. Its adjusted yield was near zero or negative through FY2022–FY2023 and has climbed gradually to ~4% as the business turned cash-generative; there is no formerly-stable ~3.5% baseline that suddenly doubled. The move up in yield is an operational improvement in adjusted FCF, not a fear-driven repricing of an already-high cash yield. The 61% price drawdown is real (covered in Dislocation), but even at the trough the adjusted yield reached only ~4.6% — the SBC drag is large enough that a two-thirds fall in the stock still did not carry the adjusted yield to the fortress bar.
Adjusted FCF ÷ (fiscal year-end shares × last close on/before Jan-31); derived from filings [10] and the daily price feed. Illustrative; yield_baseline is not_computable in the feature feed.
3. Which bar applies
The balance sheet is net cash, which puts DocuSign in the fortress class and selects the lowest reference line.
Cash, current and non-current investments from the Consolidated Balance Sheets [11]; no debt outstanding [12].
DocuSign held $602.4M in cash and equivalents, $264.1M in current investments, and $208.4M in non-current investments at January 31, 2026 — about $1,074.9M in total [13]. It carries no debt: the convertible notes were extinguished in FY2024, and the $750M revolving credit facility had no outstanding borrowings at year-end [14]. Net debt is therefore roughly −$1.07B; the framework's rule (net debt ≤ 0 → fortress) places DocuSign at the ~8–9% bar. The feature feed marks the class unknown for want of the debt and cash inputs; the filed statements resolve it plainly to fortress.
Against that bar, the arithmetic is unambiguous:
- 4.1% on FY2026 adjusted FCF against the 8% edge of the fortress bar — about 390 bps short (against 9%, ~490 bps short).
- The 3-year average of 3.0% sits ~500–600 bps below the same line.
- Even the reported 10.8% clears only the 10% default bar, and that bar does not apply to a net-cash name.
There is no bar on which DocuSign's adjusted yield currently qualifies.
4. Normalization
DocuSign is a subscription-software business — subscription was $3,150.6M of $3,219.5M in FY2026 revenue [15] — with high renewal-driven visibility and no commodity cycle. It is not meaningfully cyclical, so no mid-cycle normalization is warranted. If anything the caution runs the other way: FY2026 adjusted FCF sits near a high, not a trough. The acquisition deduction is depressed by a pause in M&A (five-year average only $30M), and reported FY2026 cash benefited from collections timing that management itself flagged as variable quarter-to-quarter. A conservative reader would treat 4.1% as a favorable rather than depressed reading — which cuts against, not toward, a dislocation-yield case.
5. The consensus check
Consensus forward FCF clears the default bar — but on the unadjusted number. CapIQ carries no SBC-adjusted FCF line, so the closest vendor proxy is its Free Cash Flow consensus mean (a reported-basis figure, vintage 24 Jul 2026).
Reported consensus FCF from CapIQ estimates (fit_features.consensus_forward_yield; source data/sp/estimates.json). Adjusted-implied = consensus FCF − assumed SBC (17%/15%/12% of consensus revenue for FY27/28/29) − ~$30M acquisitions; derived. FY2026 SBC per filing [16].
On the reported basis, consensus FCF rises from $989.9M (FY2026) to $1,328.0M (FY2029) — forward yields of 10.1% to 13.5% on today's market cap, comfortably above 10%. The sell side already agrees the reported cash engine is strong. But that is the number Ruchir's adjustment exists to discount. Consensus does not publish an SBC-adjusted FCF, so the bar must be tested by adjusting the consensus figure ourselves.
The mean-reversion underwrite — path to the fortress bar. Clearing the ~8–9% fortress bar on a genuinely adjusted basis requires adjusted FCF near $787–885M against today's $9.84B cap, roughly double the current $406M. The only credible path runs through SBC compression, since a pure cash-for-equity swap (which management is executing) lowers SBC and reported FCF by roughly equal amounts and leaves adjusted FCF unchanged — the improvement has to come from total compensation falling as a share of revenue, i.e. real operating leverage. SBC/revenue has moved from ~19% (FY2026) toward 17% in Q1 FY2027 [17], and diluted share count fell 8% year-over-year to 196.5M as buybacks began to outrun dilution [18]. Holding those trends:
- FY2027: consensus FCF $1,133M − SBC at 17% of revenue (~$594M) − ~$30M acq ≈ $509M → 5.2%.
- FY2028: $1,233M − SBC at 15% (~$564M) − $30M ≈ $639M → 6.5%.
- FY2029: $1,328M − SBC at 12% (~$479M) − $30M ≈ $819M → 8.3%, the lower edge of the fortress bar.
So a plausible path reaches the fortress bar only around FY2029 — three-plus years out — and only if SBC falls another ~600–700 bps of revenue while consensus FCF growth also lands. What consensus would have to concede beyond its current numbers is not higher FCF (it already has that) but SBC/revenue continuing to fall ~150–200 bps per year; management guidance for a "meaningful reduction" in share count and cash-for-equity substitution supports the direction [19], but the adjusted gain depends on leverage, not mix. Estimated probability of the adjusted yield clearing the ~8–9% fortress bar within three years (by FY2029): roughly 30–40%. Probability of clearing the 10% default bar in that window: near zero. Within one to two years (FY2027–FY2028), the adjusted yield most likely sits ~5–6.5% — improving, but still short of every bar.
6. FCF/revenue trend
Conversion is improving and strong on the reported line, and improving from a low base once adjusted.
Reported and adjusted FCF ÷ revenue; derived from filings [20] [21].
Reported FCF margin rose from ~21% (FY2022) to ~33% (FY2026) and has held near a third of revenue for three years — a genuinely strong cash engine that supports the durability read in Durability. The adjusted margin tells the framework's version of the story: negative through FY2023, then 8.4% → 8.2% → 12.6%. The direction is favorable and the trend does not undercut the flywheel — it is improving, not deteriorating. What it does not yet do is clear the bar. A deteriorating adjusted margin would be a red flag; a rising one that still reads 12.6% of revenue against a fortress requirement is simply a business that has not yet earned the yield the framework demands.
One further caution the reader should weigh: a large share of the reported cash benefit is non-cash tax. DocuSign released a valuation allowance and carries ~$482.5M of net operating loss carryforwards and ~$231.7M of R&D credits [22]; as those attributes deplete, cash taxes — $12.9M in FY2026 [23] — will rise toward the statutory rate, a headwind to the reported FCF that both consensus and the adjusted-yield path lean on [24].
Durability
The year-10 gate asks one binary question: will revenue and adjusted free cash flow be higher in ten years than today, with very high conviction? Docusign clears the mechanical disqualifier — revenue has risen every fiscal year since inception, so the three-year-decline flag reads false. But the conviction sources Ruchir prizes — regulatory entry barriers, capital intensity, structural monopoly — do not apply to an asset-light software leader, and Docusign's own FY2026 10-K names AI substitution as a threat to its foundational capability. That leaves a genuine doubt on the revenue side.
The conviction sources, graded for this company
Ruchir's year-10 conviction comes from five specific sources. Graded honestly against Docusign, most do not apply.
Market structure — a leading share in a low-barrier market, not a protected duopoly. Docusign is the e-signature category leader: over 1.8 million customers and more than a billion users as of January 31, 2026, with roughly 280,000 direct enterprise and commercial customers [1]. The Business tab details the share picture; the durability-relevant fact is what kind of structure it is. Docusign's filing names Adobe as its "primary global competitor for eSignature" and then a long tail — "other global software companies that have or may elect to include basic electronic signature capability in their products," and vendors focused on specific industries or product areas [2]. This is a brand-and-integration lead in a fragmented, low-switching-cost market, not the regulated monopoly/duopoly (banks, insurers) where a garage startup cannot take share. Applies weakly.
Regulatory entry barriers — the regime enables the category, it does not protect Docusign. The legal scaffolding for e-signature is the ESIGN Act and UETA in the U.S. and eIDAS in the EU — the framework that defines the "electronic signature" Docusign relies on [3]. As the 2018 prospectus put it, "both ESIGN and UETA establish that electronic records and signatures carry the same weight and legal effect as traditional paper documents and handwritten signatures," and the passage of the ESIGN Act in 2000 "solidified the legal landscape" for the whole category [4]. Crucially, these laws are technology-neutral and vendor-neutral: any compliant provider can offer a legally binding signature. Regulation lowers the barrier to the category rather than raising a wall around Docusign. Does not apply.
Capital intensity as a moat — absent. Ruchir's thesis that capital-heavy essentials survive the AI world does not fit an asset-light SaaS business. Docusign leases all of its facilities and owns no real property; its headquarters is roughly 141,000 square feet under lease [5]. Capital expenditure was $106.4 million in FY2026 against $3.22 billion of revenue — about 3.3% — funding capitalized software and data-center operations, not an irreplaceable physical network [6]. There is no replacement-cost or asset-base moat here. Does not apply.
Essentialness — real but discretionary at the margin. E-signature is embedded in customer workflows across real estate, financial services, insurance, and healthcare, and integrations and templates create switching friction. Revenue diversity is genuine: no single customer accounted for more than 10% of revenue in FY2026 [7]. But the honest measure of essentialness is expansion: dollar net retention has fallen from roughly 115% at the IPO to a recent 102%, meaning existing customers now expand only marginally faster than they churn (see the retention chart below). Essential enough to be sticky; not utility-grade. Applies moderately.
Operating history — moderate. Docusign was incorporated in 2003 and reincorporated in Delaware in 2015; it has been public since 2018 [8]. That is roughly 23 years of existence and one full demand cycle survived — the COVID pull-forward and its unwind — well short of the 30–50-year survival record Ruchir treats as conviction-grade. Applies weakly.
The structural threats, hunted
The self-check here is not perfunctory: the most material year-10 threat is named by Docusign itself, and it is exactly Ruchir's "is anyone's margin here an Amazon opportunity?" test.
AI substitution — the company's own filing says its foundational capability is becoming cheaper to replicate. The FY2026 10-K's competition section escalated the language sharply: "As AI advances make some foundational capabilities for agreements (such as analyzing, summarizing, comparing, and acting upon text) cheaper and easier to replicate, our eSignature and Intelligent Agreement Management platform may also increasingly compete with providers of LLMs, data platform companies and other enterprise software companies, and with homegrown solutions developed internally by customers" [9]. The dedicated risk factor is blunter still: "advances in AI may significantly lower the cost of developing software, enabling companies to quickly and cheaply create agents or other homegrown alternatives," and if LLM providers, "hyperscalers," or others "develop solutions that provide comparable functionality at lower cost or in more convenient formats, demand for our products would suffer" [10]. The FY2026 filing goes as far as naming "vibe coding" — software created from natural-language prompts — as a competitive substitute [11]. This is a company telling its owners that the core function — putting a legally binding signature and workflow on an agreement — is on a cost curve that AI is collapsing. On Ruchir's test, Docusign's own margin is the Amazon opportunity.
Quantifying the year-10 exposure. The threat lands on the base, not the growth edge. Docusign's AI-native pivot, Intelligent Agreement Management (IAM), reached about 12.6% of total company ARR by Q1 FY2027, with roughly 40,000 companies on the platform [12]; management targets IAM at approximately 18% of ARR (over $600 million) by the end of FY2027 [13]. Even if that target is met, roughly four-fifths of ARR remains legacy eSignature and CLM — precisely the "foundational capability" the 10-K flags as replicable. The substitution risk therefore applies to the large majority of the revenue base, with no capital, regulatory, or structural-monopoly moat to blunt it — only brand, integration depth, and product execution. And execution is not a year-10 moat: a company that merely out-builds competitors has protection only for as long as it keeps out-building.
The threat is already in the price, and in sell-side models. The stock fell from a peak of $106.99 (December 2024) to a trough of $41.75 (February 2026), a 61% drawdown, driven substantially by this AI-disruption overhang; the anatomy is in Dislocation. External analysts reset targets on an explicit "AI risk framework" — Jefferies moved to Hold with a price target cut from $105 to $45 in March 2026, and other desks trimmed similarly. The bear mechanism they cite is specific: AI agents that read, negotiate, and act on agreements could erode the seat-based licensing on which Docusign's model rests.
Regulatory reversal, customer concentration, pricing pressure. Regulatory reversal is a low year-10 risk — the ESIGN/UETA/eIDAS framework that legitimizes electronic signatures is entrenched, and evolving EU trust-services rules cut toward compliance cost rather than existential threat [14]. Customer concentration is not a threat — the book is diversified with no customer over 10% [15]. Pricing pressure is real: Adobe bundles Acrobat Sign into Acrobat subscriptions rather than selling it standalone, and Box and Dropbox fold signing into their storage suites — the competitive question the Competition tab frames as whether signing gets absorbed into a document suite for free.
The disqualifier check — revenue history
Ruchir's one mechanical disqualifier: revenue declining high-single-digit for three consecutive fiscal years after a long existence. Docusign does not trip it.
Source: fit_features.revenue_trajectory, derived from filed Consolidated Statements of Operations; FY2026 figures cross-checked to the FY2026 10-K [16].
Revenue has risen in every one of the ten fiscal years on record. The fit_features.revenue_trajectory flag confirms it: consecutive_decline_years is 0 and three_year_hsd_decline is false. The structural-decline test (X3) is therefore checked and absent — there is no realized revenue decline to point to.
What the flag does not capture, and what belongs here plainly, is the shape: year-over-year growth decelerated from roughly 49% (FY2021) to about 8% (FY2026). That is deceleration, not decline — a maturing category rather than a shrinking one — but it removes any claim that revenue growth is structurally protected. The falsifier to watch, in Ruchir's own terms, is the first year revenue growth turns negative; nothing in the record to date shows it.
The year-10 case, both ways
The strongest case that year-10 revenue and adjusted FCF are higher. Docusign enters the decade as category leader with 1.8 million customers, deep workflow integrations, and the brand that made "e-signature" synonymous with legality [17]. The balance sheet is net cash — $866.5 million in cash and short-term investments, additional long-term investments, and no borrowings under its credit facility [18], so it can outlast a long transition. Reported free cash flow has risen every year to $1.06 billion in FY2026 [19], and consensus (per fit_features.consensus_forward_yield) models FCF continuing up from roughly $854 million (FY2025) toward $1.33 billion by FY2029 — the sell side does not forecast decline. The secular tailwind (paper-to-digital agreements) is intact, and management is repositioning the platform to sell AI rather than be displaced by it, with IAM growing double-digits and platform partnerships spanning Anthropic's Claude and Salesforce's Slack [20].
The strongest doubt. Docusign's own FY2026 10-K states that AI is making the foundational capability underpinning most of its revenue "cheaper and easier to replicate" by LLM providers, hyperscalers, and customers' homegrown agents [21] [22]. That threat sits on roughly four-fifths of ARR, is defended only by brand, integration, and execution — none of which is a structural moat — and arrives as growth has already decelerated to ~8% and expansion (dollar net retention) has flattened to ~102%. The consensus that models rising FCF looks out three years; the gate asks about ten.
The read. The mechanical disqualifier does not fire, and higher year-10 revenue and adjusted FCF are a defensible base case for the next few years. But P1 does not ask whether growth is likely — it asks whether it is near-certain. Here there is a genuine, company-acknowledged doubt on the revenue side: AI-driven commoditization of the core signing-and-agreement function, against a business with no capital-intensity, no regulatory, and no monopoly protection. That doubt is exactly the kind the gate is built to catch, so the year-10 gate does not hold with very high conviction — the genuine doubt is AI substitution of the foundational capability, flagged by Docusign's own filings. The counter-evidence adjacent to that read — a net-cash balance sheet, still-rising reported FCF, and a credible AI pivot — is real, and is why the doubt is a doubt rather than a conclusion of decline.
FCF consistency (P2)
The profile's basis is adjusted ("real") free cash flow — reported FCF less stock-based compensation less the trailing five-year average of acquisition spend. The deterministic feature that would grade its stability, fit_features.fcf_stability, is not computable: stock-based compensation was absent from the structured cash-flow feed, so the profile could not build the rolling five-year adjusted-FCF series (recorded in data gaps). The primary filings do carry SBC, so the series can be reconstructed from them — shown below as illustrative, not as the deterministic feature.
Illustrative adjusted FCF = reported FCF − SBC − 5-yr avg acquisitions, derived from filed Consolidated Statements of Cash Flows (FY2022–FY2026 10-Ks) [23] [24] [25]. The deterministic fit_features.adjusted_fcf series is not computable (SBC absent from the structured feed).
Two things stand out. First, reported FCF is genuinely stable and rising — positive and growing in each of the last five years, with one negative episode (FY2017, pre-IPO). That negative was a young-company year, not a business-model-inherent underwriting loss on a 5–8-year cadence; there is no insurance- or bank-style cyclicality here, because subscription software cash flow recurs rather than cycles. Second, on the profile's real basis the record is much shorter and thinner: adjusted FCF was roughly breakeven in FY2022, negative by about $147 million in FY2023, and only turned solidly positive from FY2024 — as reported FCF outgrew a roughly flat ~$610–622 million SBC load. Stock-based compensation, at about 19% of revenue, is the swing factor; the SBC add-back is visible in the FY2026 non-GAAP reconciliation [26].
So P2 reads two ways. Predictability is not the problem — the cash flows recur and are not volatile. The problem is that the positive adjusted-FCF history is only about three years long, and its stability depends on reported FCF continuing to outrun an elevated SBC charge. That FY2026 adjusted figure of roughly $406 million against the ~$9.84 billion market cap frames a ~4.1% real yield — the Yield tab computes the yield against the bar. For durability, the point is narrower: adjusted FCF is consistent and rising now, but has too short a positive track record to describe as a proven five-year-stable series, and it rests on SBC not re-inflating.
The dollar-net-retention record
Sources: ~115% at IPO, 2018 prospectus [27]; 98% trough, Q4 FY2024 call [28]; 102% recent, Q1 FY2027 presentation [29].
Dollar net retention is the cleanest single gauge of essentialness for a subscription business: it measures whether the installed base expands or contracts. Docusign's fell from ~115% at the IPO to a 98% trough in Q4 FY2024 — below 100%, meaning the base was shrinking net of churn — before recovering to ~102% through Q1 FY2027. The recovery is real and supports the essentialness case; the level, barely above breakeven, is why essentialness grades moderate rather than utility-grade. Whether the base keeps expanding as AI reshapes the category is the year-10 question in one number.
Self-Help
Docusign can rescue its own shareholders on the balance sheet: no debt, roughly $1.1 billion of cash and investments, an undrawn $750 million revolver to 2030, and free cash flow above $1 billion a year [1]. The buyback engine is real and scaling — $1.76 billion repurchased across FY2023–FY2026 [2]. The tension is stock-based compensation: at $622 million in FY2026 it consumes most of the repurchase, so the share count is only now inflecting down after years of dilution [3].
The balance sheet against the problem's duration
Docusign carries no funded debt. The 2023 and 2024 convertible notes were repaid in cash during the year ended January 31, 2024, and nothing has replaced them [4]. In May 2025 the company signed a new secured revolving facility of $750 million, extendable by a further $250 million, maturing in May 2030; there were no outstanding borrowings under it as of January 31, 2026, and the company was in compliance with all covenants [5]. The only ongoing cost is a commitment fee of 0.10% to 0.30% on the undrawn balance [6].
Liquidity sits at $866.5 million in cash, cash equivalents and short-term investments, plus $208.4 million of long-term investments — roughly $1.1 billion of resources against which no principal is due [7].
Cash + Investments ($M)
Funded Debt ($M)
Undrawn Revolver ($M)
FY2026 Free Cash Flow ($M)
Source: FY2026 Form 10-K, Liquidity and Capital Resources [8] and Consolidated Statements of Cash Flows [9].
There is no debt maturity schedule to draw. With zero funded debt, the year-by-year "maturity wall" the framework asks for is empty. The only contractual maturities the filings carry are operating leases and non-cancelable cloud/marketing commitments — obligations funded many times over by annual cash flow, shown below for completeness rather than as refinancing risk [10].
Note: FY2032 lease figure is the "thereafter" bucket ($150.3M undiscounted), not a single year. A separate $280.4M minimum cloud commitment runs through fiscal 2030 and is excluded above. Source: FY2026 Form 10-K, Notes 9 and 10 [11].
Capital allocation is under no pressure to divert toward debt paydown. Consensus free cash flow is modelled to rise from roughly $1.13 billion in FY2027 to $1.33 billion by FY2029, so nothing about the problem's duration forces cash away from repurchases at the moment they matter most.
Source: derived from consensus estimates; fit_features.consensus_forward_yield (per-FY CapIQ mean free cash flow).
The repurchase record — executed, not authorized
This is not an empty authorization. Cash actually spent on repurchases, from the cash-flow statement, has climbed every year since the program began in March 2022 [12] [13].
Source: FY2026 10-K cash-flow statement (FY2024–FY2026) [14] and FY2024 10-K cash-flow statement (FY2022–FY2023) [15]. Matches fit_features.share_count_trend.buyback_cash_per_year.
Repurchases across FY2023–FY2026 total $1.76 billion, and the pace has since accelerated: the Q1 fiscal 2027 call reported $318 million bought back — "our highest quarterly buyback on record" — leaving $2.4 billion of remaining authorization after a $2.0 billion top-up in March 2026 [16] [17].
The prices paid have run well above today's quote. Averaging the aggregate repurchase cost against shares retired each year, Docusign paid roughly $47.6 per share in FY2024, $62.5 in FY2025 and $73.9 in FY2026 — the last two years above the current $47.04 price [18]. The Q1 fiscal 2027 buyback was explicitly timed to a "lower stock price during the quarter," so the most recent capital was deployed nearer to the trough [19].
Source: aggregate purchase price ÷ shares repurchased, FY2026 10-K Note 11 [20]; current price $47.04 (2026-07-23), fit_features.market_cap.
The share count — the framework's hard-fail test
The framework fails a company outright when its share count keeps rising on stock-based compensation or serial M&A. Docusign is the borderline case. On the deterministic feature's weighted-average basis, the count still rose at a 2.4% five-year CAGR — but that figure is a legacy of the heavy-dilution years of FY2020–FY2022, before buybacks began [21].
Source: fit_features.share_count_trend (diluted weighted-average shares from the income statement; FY2024–FY2026 anchors on p.103, earlier years from prior 10-Ks) [22].
The primary filings show the inflection the smoothed series muffles. Shares issued and outstanding on the balance sheet peaked at 205.3 million in January 2024, then fell to 202.5 million (January 2025) and 197.8 million (January 2026) [23]. Diluted weighted-average shares dropped 8% year-over-year, from 212.8 million in Q1 fiscal 2026 to 196.5 million in Q1 fiscal 2027, and management guides the full year to 190–195 million [24] [25]. The hard-fail condition — a share count that keeps rising — does not cleanly trigger: buybacks now more than offset dilution and the count is shrinking.
What survives the reversal is the drag. Stock-based compensation was $622 million in FY2026 against a $869 million buyback, so nearly three-quarters of the repurchase runs to neutralize dilution rather than to shrink the base [26]. Management put the arithmetic plainly on the Q4 fiscal 2026 call: the $869 million was "82% of our annual free cash flow… when including the additional funds used to offset taxes due on RSU vesting, this rate is slightly over 100% for the year" [27]. The buyback flywheel exists, but a large share of its energy is spent standing still.
Management's buyback intent, from the record
Management has named the buyback as the primary use of free cash flow on every call in the reviewed history, and returns capital "opportunistically" while keeping the balance sheet clear for optionality [28]. The intent has been consistent and acted upon:
"We have no debt on the balance sheet. This financial stability combined with consistent free cash flow generation enables us to invest in the business while also returning capital to shareholders opportunistically." — CFO Blake Grayson, Q3 fiscal 2025 call (Dec 5, 2024) [29]
On priority between repurchases and M&A, management has been asked directly and answered that the buyback is the default until an acquisition clears a high bar. Pressed in Q3 fiscal 2026 on why not "lean a little harder into M&A," Grayson said the balance sheet optionality is kept "for those opportunities as they present themselves… we have a high bar for those acquisition conversations," and that for now "the buyback, we think, is a great opportunity to do that" [30] [31]. M&A has produced one named deal in the reviewed history — Lexion, at $143.6 million net of cash in fiscal 2025 — so the "actively looking" language has not translated into serial acquisition [32].
The company also frames the repurchase explicitly as dilution control. In Q1 fiscal 2026 it announced an additional $1 billion authorization "to continue opportunistically repurchasing shares," and installed a 10b5-1 program to buy outside open windows [33] [34].
Insider buying alongside is absent. Across the Form 4 record for the trailing window, insiders recorded grants, option exercises, tax-withholding dispositions and 10b5-1 open-market sales — and no open-market purchases. Economic ownership is thin: all current directors and executive officers as a group held 1,156,501 shares — under 1% — as of March 15, 2026, with CEO Allan Thygesen at 219,801 shares, also under 1% [35]. The register is dominated by index holders — BlackRock at 12.2% and Vanguard at 10.9% [36].
The levered exception does not apply
The framework tolerates leverage only when the adjusted yield is very high and paired with a demonstrated multi-year share-count halving. That branch is moot here: Docusign is net cash with no funded debt [37]. The balance sheet is assessed on the fortress test, not the levered exception.
The absurdity check
At the current price the entire float is nowhere near cheap on any cash-flow measure. Market capitalization is $9.84 billion; reported FY2026 free cash flow is $1.059 billion, so it would take about 9.3 years of reported free cash flow to retire the whole float [38].
On the framework's preferred basis — free cash flow after stock-based compensation and average acquisition spend — the figure roughly doubles. Deducting $622 million of SBC and a five-year average acquisition spend near $30 million leaves illustrative adjusted free cash flow of about $407 million, which stretches float retirement to roughly 24 years [39]. Either way, the price is not making the ~3-year claim that flags a genuine dislocation. The gap between the two numbers is itself the point, and the full yield computation lives in Yield.
Note: the deterministic feature marks adjusted FCF and float-retirement years as not_computable (its cash-flow source lacked an SBC field). The 9.3-year and ~24-year figures above are analyst-derived from the 10-K cash-flow statement, shown as illustration, not as the feature's output. See data gaps.
Dividend safety — not applicable
Docusign pays no dividend and states it does not expect to: "We have not declared, nor do we expect to declare dividends" [40]. The return case rests on repurchases, not yield, so dividend coverage does not enter.
Management credibility
Promise-versus-delivery across the recent archive is, on the numbers, strong. Testing the most material guides set one to two years ago against outcomes:
- FY2026 billings guided to $3.30–$3.354 billion (7% growth) in March 2025 — delivered $3.4 billion, up 10%: beat [41].
- FY2026 non-GAAP operating margin guided to 27.8–28.8% in June 2025 — delivered 30%: beat [42].
- FY2026 revenue guided to $3.208–$3.212 billion in December 2025 — delivered $3.2 billion: met [43].
- IAM share promised at a "low double-digit percentage… by Q4 of fiscal 2026" — landed at 10.8% of total ARR: met, but the reporting base shifted from "subscription recurring revenue book of business" to total ARR mid-year, so the scorecard is not strictly like-for-like [44].
- Q1 fiscal 2026 billings — the one clear miss: billings ended slightly below the guided range, which management attributed to early-renewal timing rather than demand [45].
Two texture points cut against an unqualified clean read. First, the metric that produced the single miss — billings — was retired going into fiscal 2027, which removes an independent check on bookings even as management says it is "positioned to begin accelerating." Second, when Patrick Walravens pressed on the still-single-digit growth in Q1 fiscal 2027, the CEO opened with a deflection rather than evidence: "I don't know that we ever set a timeline. I'm not disappointed with our progress" [46].
Taken together, this is not the promotional pattern the framework excludes — big claims, repeated misses, and no ownership. Claims have mostly been delivered or beaten, with one timing-related miss; the reservations are metric retirement and thin insider economic ownership, not a record of overpromising. The founder-era promotional risk is absent, and the historical securities class action tied to pandemic-era statements was dismissed in the company's favor in January 2026 [47].
Clock
What would make the market re-recognize value in Docusign is not an industry repricing cycle — it is a company-specific reacceleration story with a mechanical tailwind already running. The denominator is shrinking fast: diluted shares fell 8% year-over-year in Q1 FY2027 and management holds a $2.4 billion repurchase authorization against a $9.8 billion market cap [1]. The re-rating still needs a printed quarter proving ARR growth is accelerating, not stalling. On this name's own history, drawdowns of comparable depth have taken 12–20 months to round-trip.
The re-rating mechanism — what specifically closes the gap
Docusign does not fit the canonical dislocation-and-repricing pattern (the insurer whose premiums reset, the bank whose loss rates normalize). There is no industry pricing round on a calendar that re-rates the whole sector. The gap here closes — or does not — through four company-specific mechanisms, in descending order of how visibly they are already in motion.
1. The buyback denominator — in motion now, the strongest mechanism. In Q1 FY2027 Docusign repurchased $318 million of stock, its largest quarterly buyback on record, taking diluted weighted-average shares to 196.5 million, an 8% decline from 212.8 million a year earlier [2]. For the full FY2026 the company retired 11.8 million shares for $869.1 million [3], and in March 2026 the board added $2.0 billion to the authorization, leaving $2.4 billion available [4]. FY2027 guidance calls for average diluted shares of 190–195 million [5]. At roughly $1 billion of annual free cash flow against a $9.8 billion market cap, the authorization alone is about a quarter of the equity, and the pace is compounding EPS before any operating growth. The counter-fact sits in the same breath: stock-based compensation still ran 17% of revenue in Q1 FY2027 [6], so a large share of gross repurchases offsets dilution rather than shrinking the count — the Yield tab carries the adjusted-yield arithmetic.
2. Growth reacceleration, confirmed by a printed ARR number. Management guides FY2027 ARR growth of 8.25%–8.75%, an acceleration versus the prior year, with its AI-native IAM platform expected to reach roughly 18% of total ARR (over $600 million) by fiscal year-end [7]. The mechanism the market can price is disclosure itself: starting with Q4 FY2026, Docusign began reporting annual recurring revenue and giving full-year ARR growth guidance for FY2027 [8]. Because a full-year ARR guide is effectively a Q4 number, the reacceleration prints in the fiscal fourth quarter — the candidate re-rating quarter is Q4 FY2027, reported around mid-March 2027.
3. Cost and margin normalization rolling off. FY2027 non-GAAP operating margin is guided to 30.5%–31.0%, a step up from FY2026, and management expects gross margin to stop declining once the bulk of its cloud-migration investment completes — the majority of on-prem-to-cloud data-center migrations are already done [9]. As that headwind ends, more of each revenue dollar converts to the free cash flow that funds the buyback.
4. A feared event failing to happen. The bear thesis is that large-language models commoditize e-signature and that growth is stuck in the high single digits permanently. The counter-evidence Docusign is putting on the board is partnership integration — IAM connected to Anthropic's Claude, OpenAI's ChatGPT, and Google Gemini through an MCP server, positioning the agreement data set as an AI beneficiary rather than a casualty [10]. Each quarter that revenue holds 8–9% growth with IAM tracking to its 18% ARR target erodes the "structural decline" reading.
The catalyst calendar — dated
Docusign has beaten consensus EPS in every one of the last twelve reported quarters (CapIQ/reported earnings history), and the low bar it now guides to is set against a stock that has already fallen 61% from its December 2024 peak. The dated checkpoints:
Source: earnings-date cadence from company reporting history (Q4 FY2026 reported 2026-03-17; Q1 FY2027 reported 2026-06-04) and management's ARR-disclosure commitment [11].
The single most important date is the fiscal-year-end ARR print around mid-March 2027: it is the first time the acceleration the whole thesis rests on becomes a number the market can mark, rather than a management forecast.
Base rates from Docusign's own history
Docusign is a young public company — it IPO'd in April 2018 — so its price record holds four drawdowns of 40%+ depth, and the swings are violent. The current episode, peak $106.99 (Dec 6, 2024) to trough $41.75 (Feb 23, 2026), is the second-deepest at −61%, exceeded only by the 2021–2023 bubble unwind (derived from the run's daily price series).
Source: derived from the run's daily price series (data/prices/daily.json), quarter-end closes; drawdown episodes computed on daily data.
Source: derived from data/prices/daily.json; depth = trough close / peak close − 1, durations in calendar days. Recovery = first close back at the prior peak.
Two facts govern the base rate. First, when Docusign has recovered a deep drawdown, it has taken time: the 2018 episode ran 350 days from trough back to its old high, the 2023 episode 348 days. Second — and this is the harder fact — the largest drawdown, the 2021–2023 unwind, has never round-tripped: after peaking at $310 in September 2021 the stock has spent nearly three years ranging between roughly $40 and $107, and today sits 85% below that peak. A re-rating here means a recovery within the post-2022 range, not back to bubble highs; the arithmetic of the thesis does not require the old high and the base rate says it will not come.
The upside case has precedent too: from the October 2023 trough of $38.53, Docusign ran to $106.99 by December 2024, a 178% gain in about fourteen months, on exactly the sentiment-and-buyback combination now in play. Quality-adjacent software names swing far more than their intrinsic value does; the same volatility that produced the −61% draw can reverse quickly once a printed quarter turns the narrative.
The 18-month test
Re-recognition within roughly 18–24 months is a reasonable expectation conditional on the ARR reacceleration being real — because the buyback mechanism is mechanical and already running, and because the name's own base rate (350, 348 days trough-to-recovery in prior comparable episodes) fits inside that window. It does not require cycle repair over years; it requires one to two fiscal-year-end ARR prints that confirm growth has troughed. This read is falsified if FY2027 ARR growth comes in below the guided 8.25%–8.75% and revenue growth slips toward mid-single digits — the "structural decline" reading would then be correct and the dislocation deserved, not temporary. That falsifier ties to the Damage Math trial and the What-Would-Change-This ledger on the Fit tab: the mechanism fails to fire if reacceleration does not print.
What consensus expects, and when
The sell side is lukewarm, not capitulated. Of the analysts in consensus, 16 rate Docusign hold, with 2 buy and 3 outperform against just 1 underperform and no sells — a mean target of $59.32 and median $55 versus the $47.04 close, implying roughly 17–26% upside, with the low target at $46.89 essentially at the current price (CapIQ consensus, 18 target estimates).
Current price ($)
Median target ($)
Mean target ($)
Upside to mean
Source: consensus target from CapIQ estimates (data/sp/estimates.json, street block; 18 target-price estimates, low $46.89 / median $55 / mean $59.32 / high $90); current price $47.04 on 2026-07-23 (data/prices/daily.json). Recommendation split: 16 hold, 2 buy, 3 outperform, 1 underperform, 0 sell.
The distribution is telling: nobody sees meaningful downside (low target at spot) and nobody is pounding the table (a lone $90 outlier drags the mean above the $55 median). This is a "show-me" street — not the piled-in consensus Ruchir avoids, but also not the capitulation that marks maximum fear.
On when the recovery shows up in printed numbers, consensus does not model a snap-back — it models a compounding. CapIQ free-cash-flow estimates rise from about $1.13 billion in FY2027 to $1.23 billion in FY2028 and $1.33 billion in FY2029; normalized EPS is modeled at $4.53 for FY2027 and $5.10 for FY2028.
Source: CapIQ consensus estimates (data/sp/estimates.json, annual block; FCF and normalized-EPS means). Estimate momentum: the FY2028 revenue mean rose to $3,758M "now" from $3,696M 180 days ago, and FY2027 normalized EPS to $4.53 from $4.11 — quiet upward drift, not deterioration.
Against $47.04, consensus FY2027 FCF of $1.13 billion is an 11.5% forward yield (per the run's deterministic consensus_forward_yield feature) — the sell side's own numbers clear a high-single-digit bar. The re-rating catalyst consensus is implicitly waiting on is the FY2027 ARR print in March 2027 that turns the modeled acceleration into a reported one.
The instrument facts (I1)
Listed options on Docusign exist and trade actively: Docusign is a standard-cycle optionable Nasdaq name with January-expiration LEAPS in its listing history (January-cycle LEAPS have been listed on the name across multiple years), so contracts with expiries of 12 months and beyond are available on the standard cycle (Nasdaq listing record). Underlying liquidity is ample — average daily share volume runs near 3.7 million shares (60-day), and the run's liquidity data (data/tech/liquidity.json) classifies the name "institutionally tradable" — which supports a deep listed-options market, though aggregate open interest at the longest-dated tenors was not separately confirmed to a single dated source.
On implied volatility, from a dated citable source (AlphaQuery, as of 2026-07-23): 30-day mean implied volatility was 53.9% and 180-day mean implied volatility 56.3% (AlphaQuery, as of 2026-07-23). Against the framework's reference lines — up to roughly 50–55 acceptable, 60–70 elevated — Docusign sits at the top of the acceptable band on near-dated tenors and just into elevated on the longer-dated ones, consistent with realized volatility that spikes around its quarterly prints (the earnings-day moves in this window ranged from +28% to −19%).
These are stated as facts, not as recommendations: no strike, expiry, structure, or sizing is implied. The framework's instrument gate is a factual check on whether the position can be held long enough for the ~18-month clock to run, and long-dated listed options on Docusign exist to permit that.