DocuSign, Inc.'s management explains the business in its own materials. The slides below do the most of that work, pulled from the documents preserved in Sources. Each source link opens the complete presentation at that slide in a new tab.
The current company overview: what agreements are, what IAM does, how Docusign sells it, and the financials as they stand. · Open the full document →
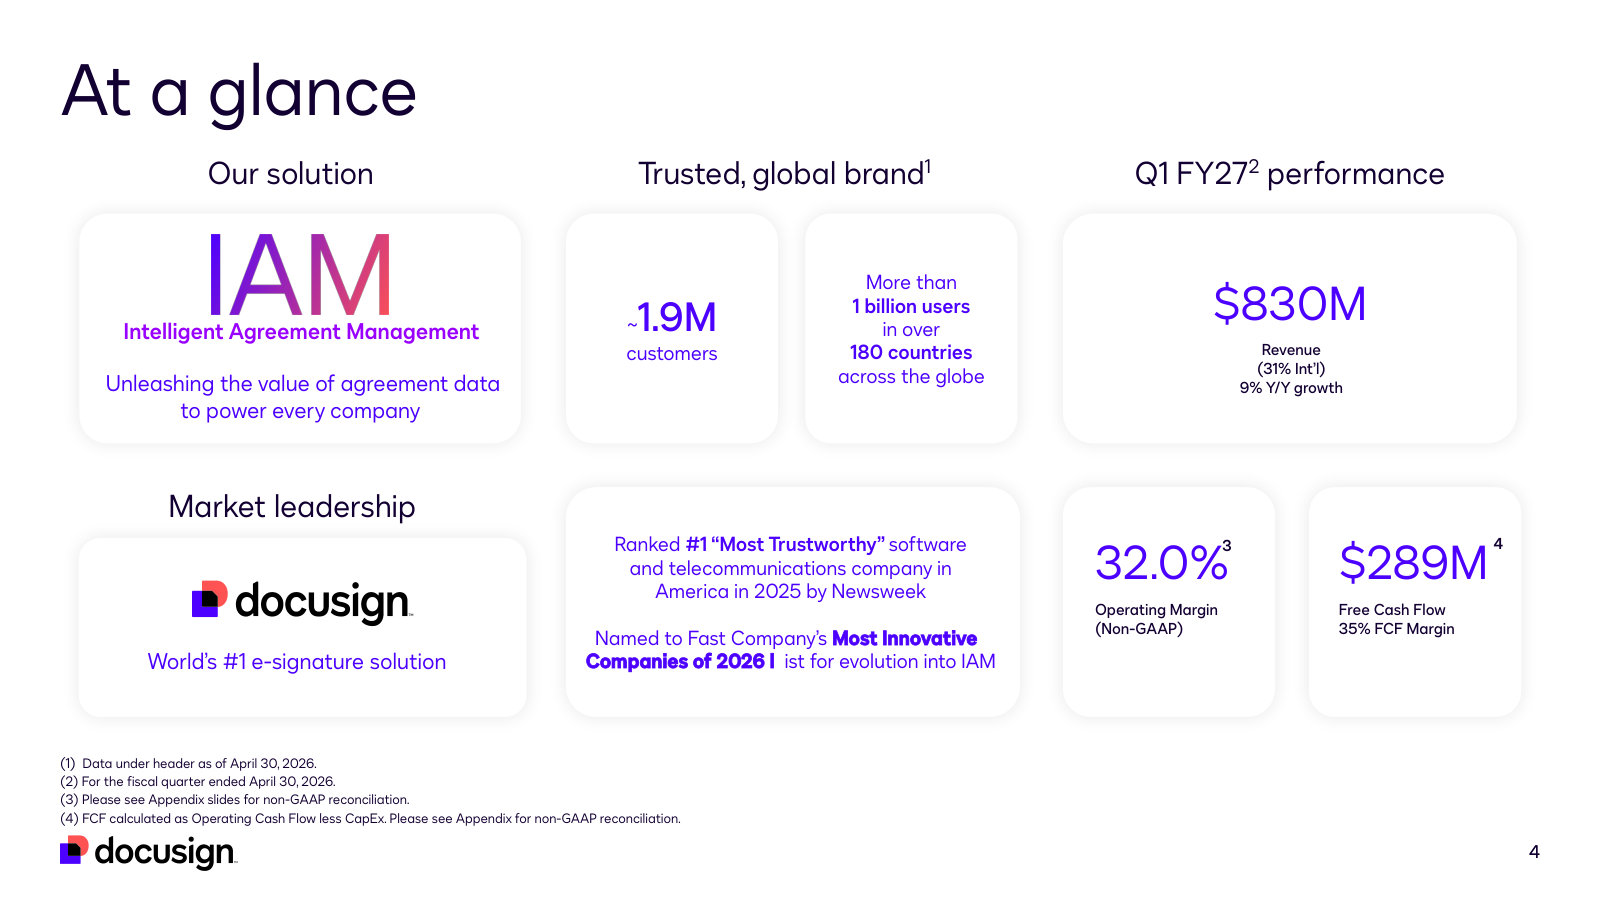
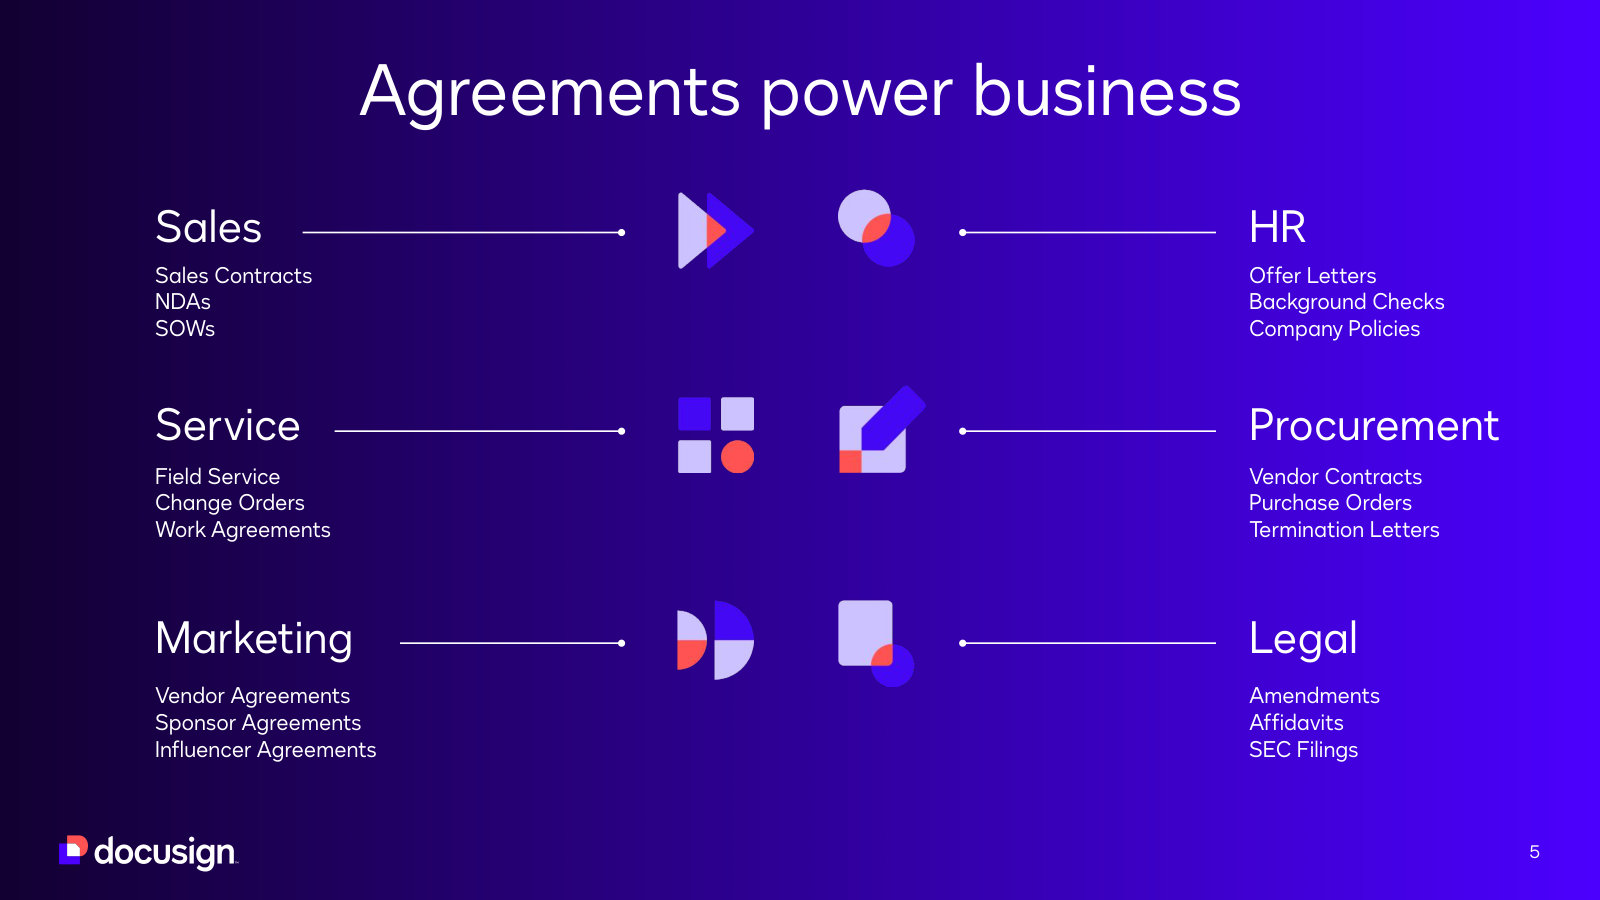
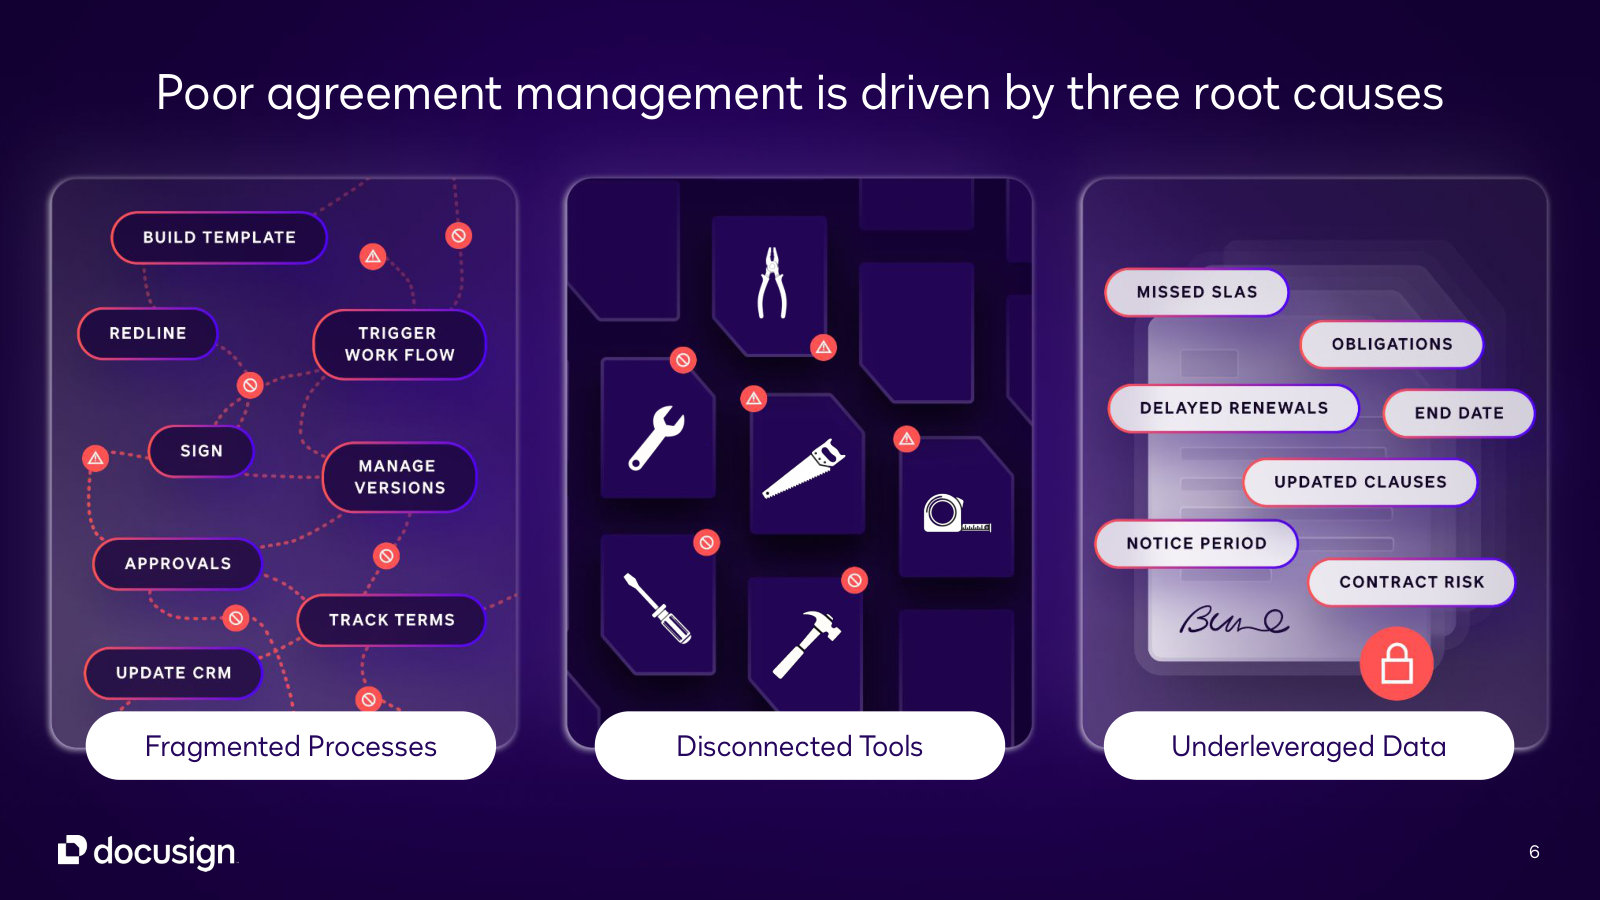
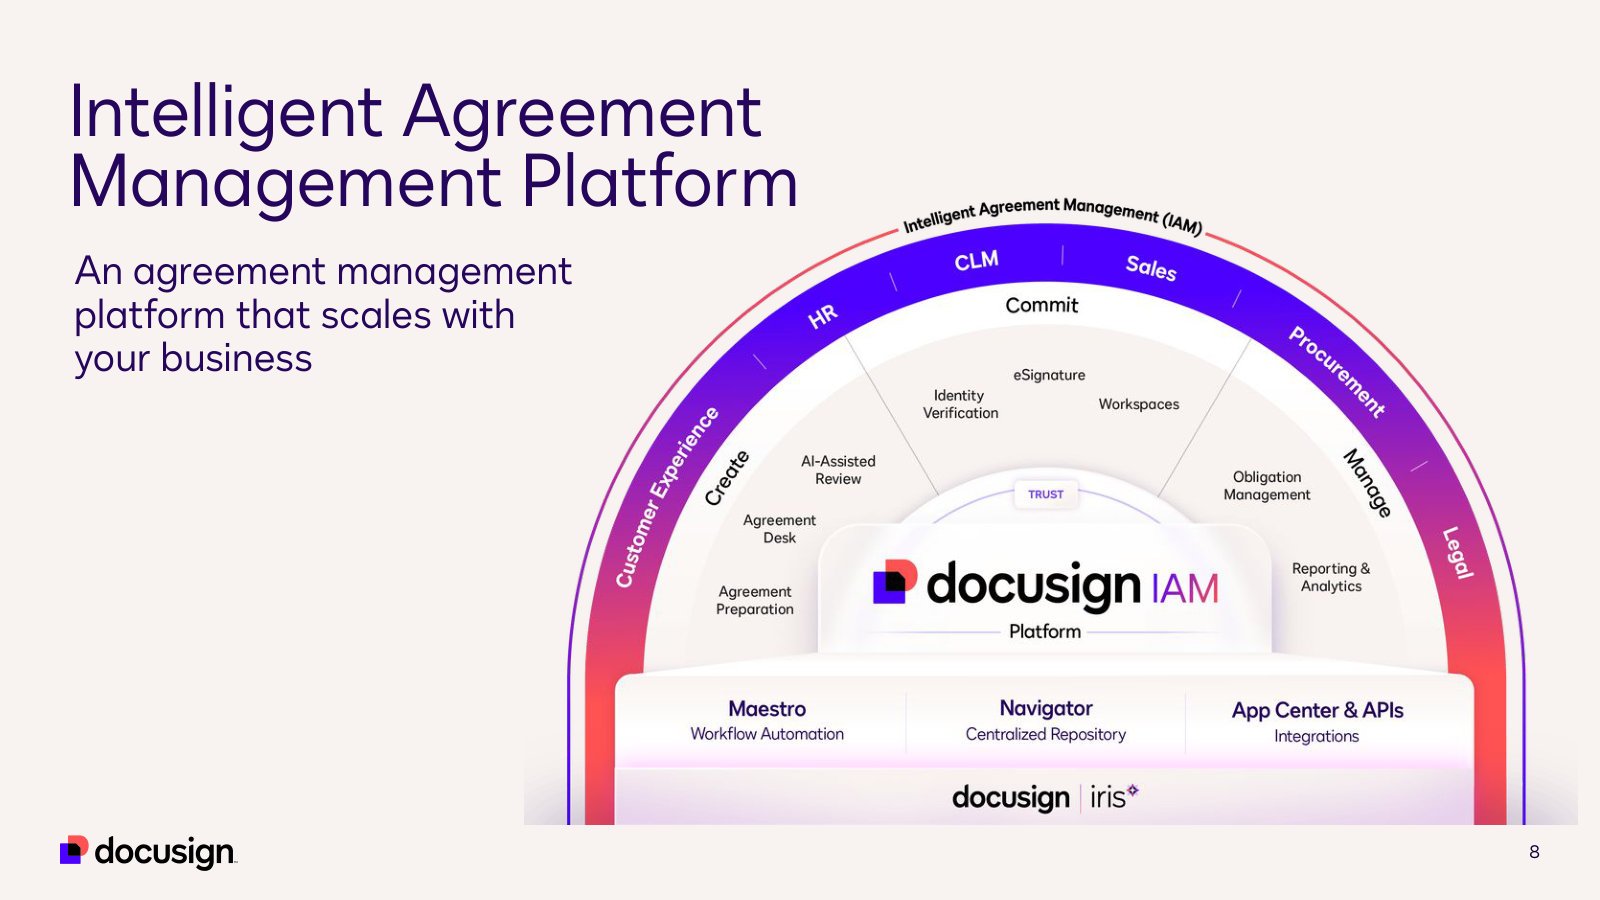
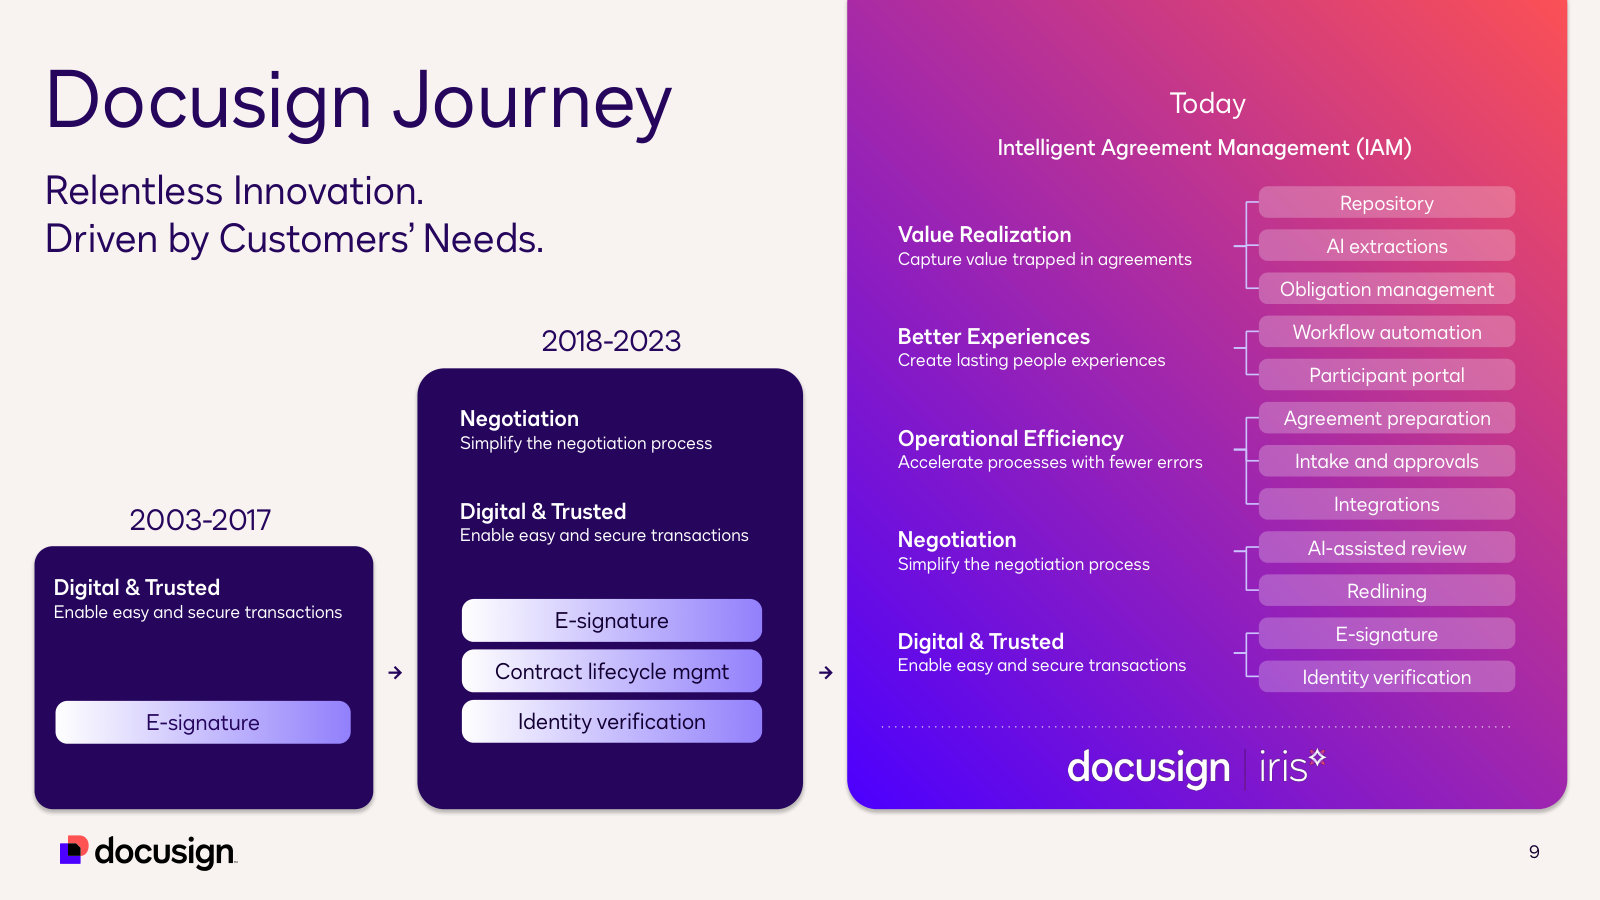
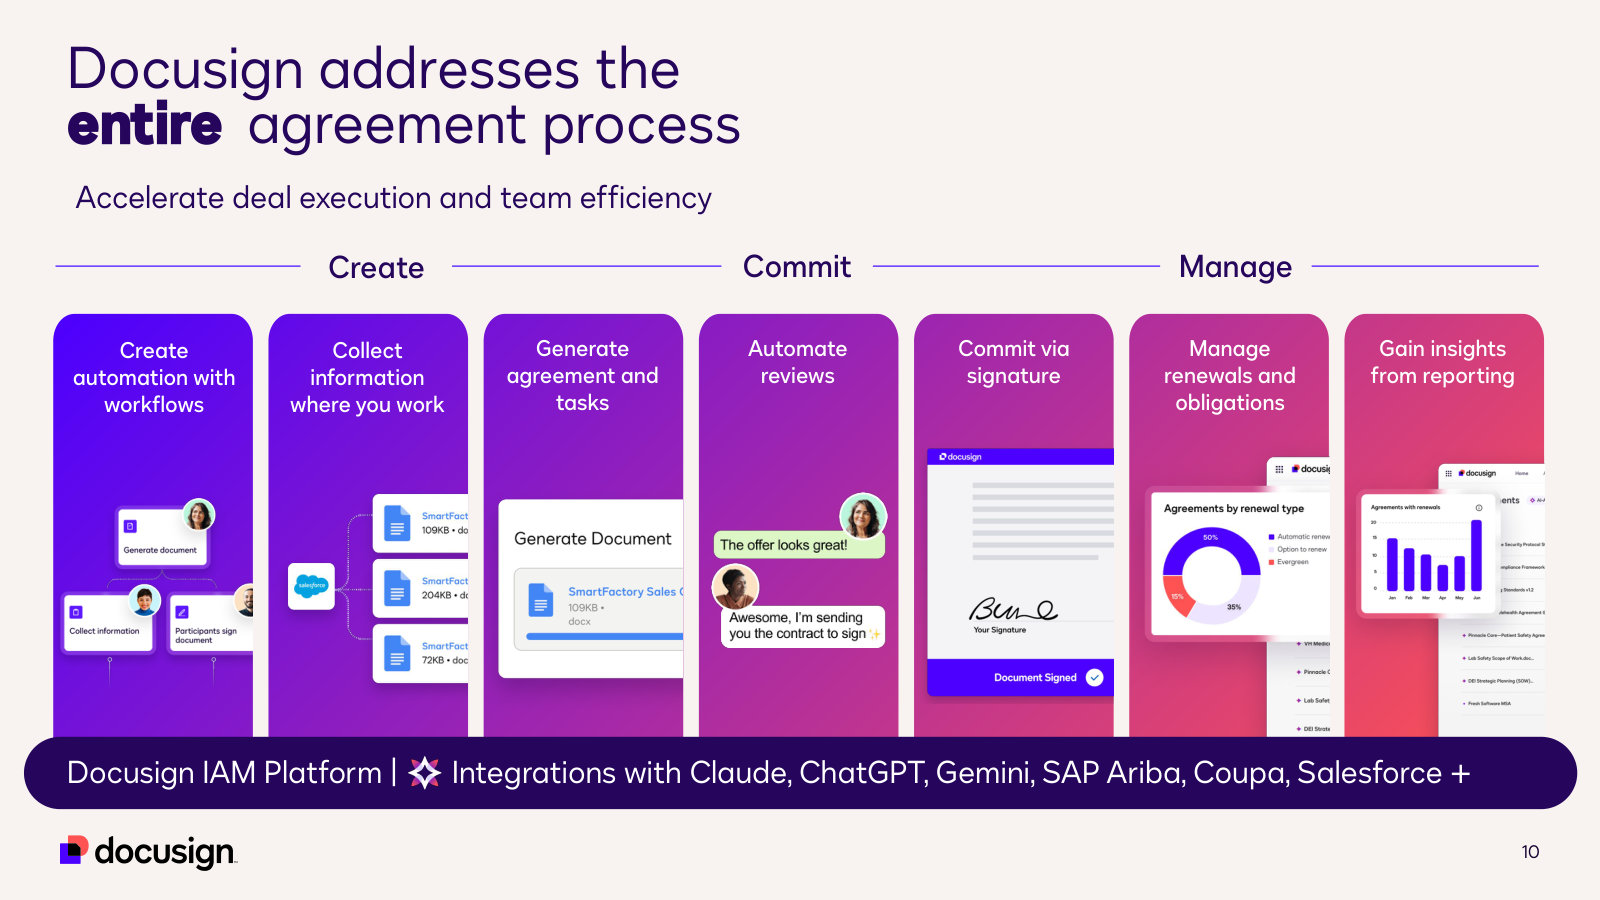
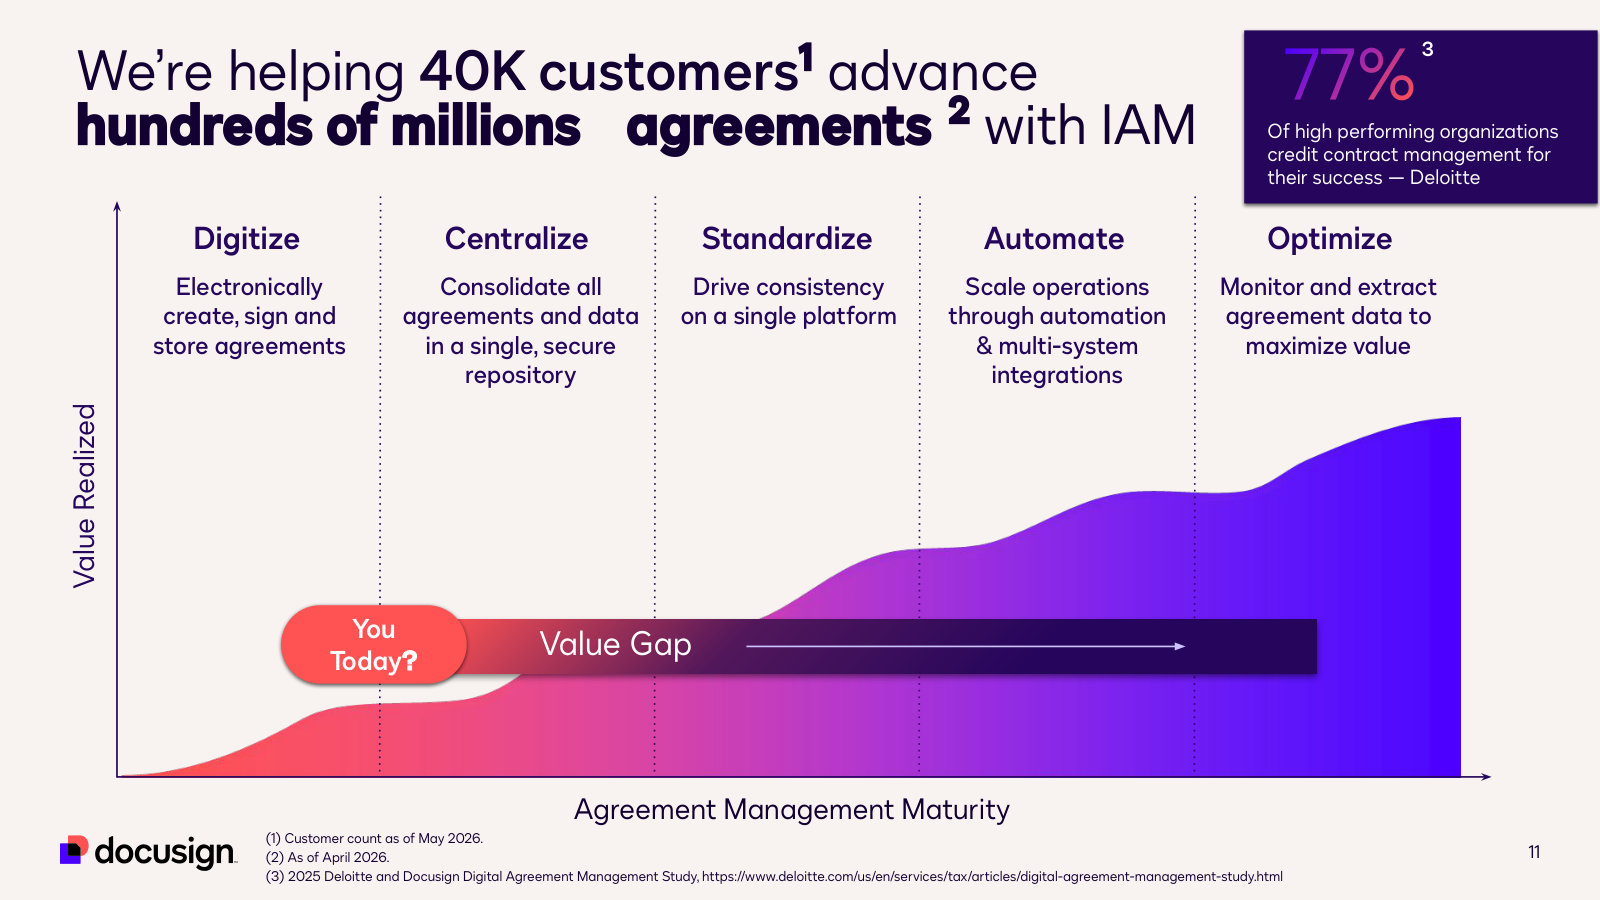
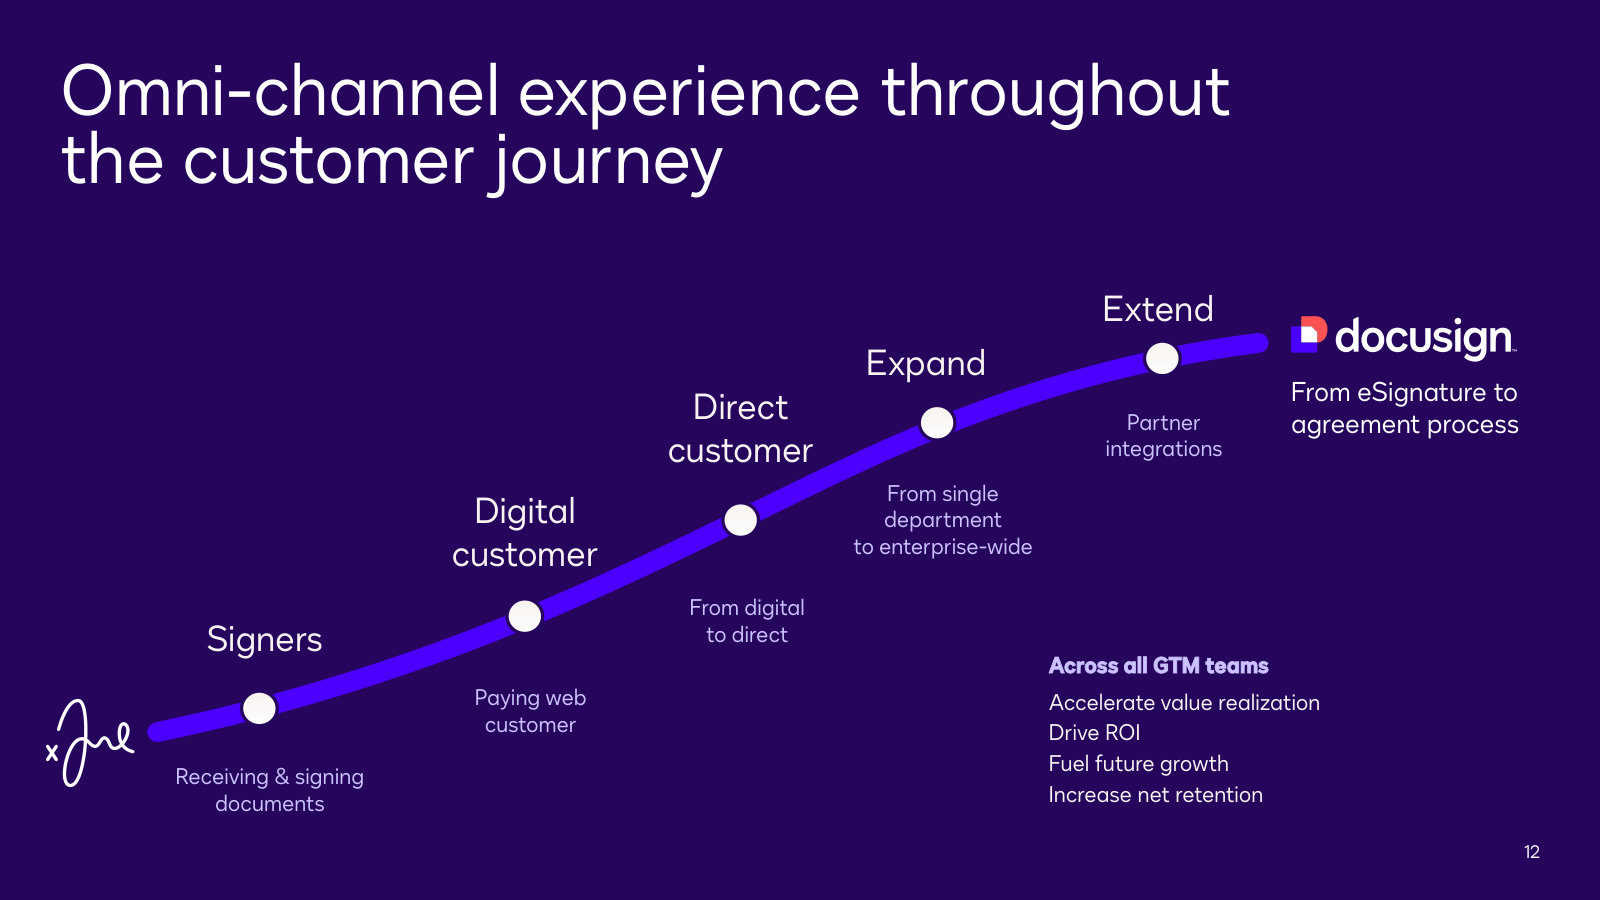
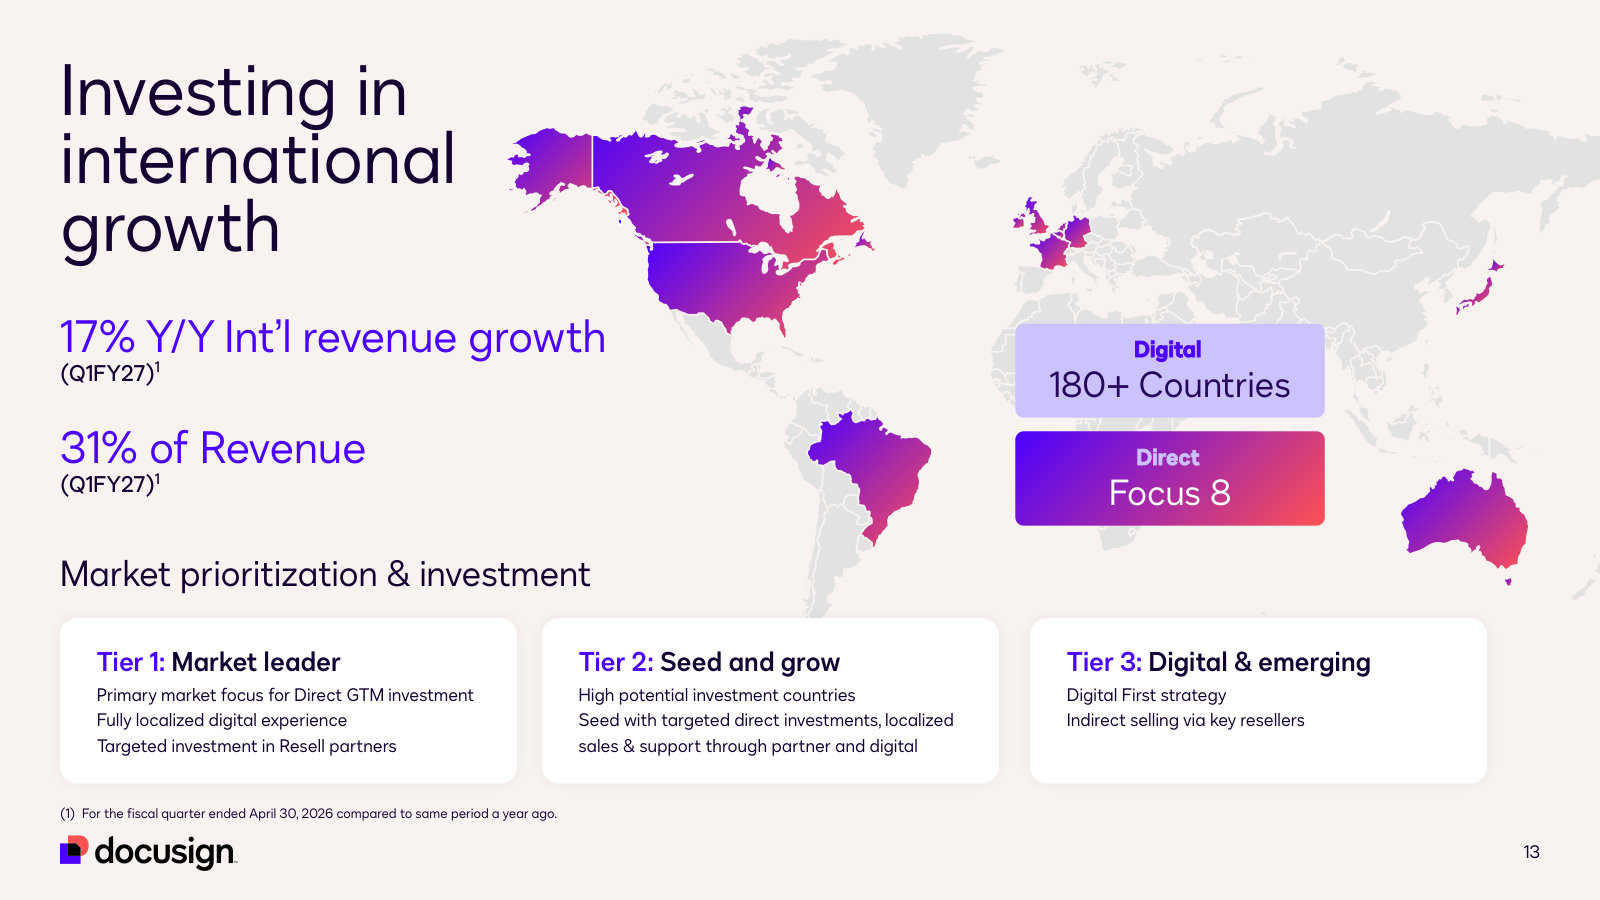
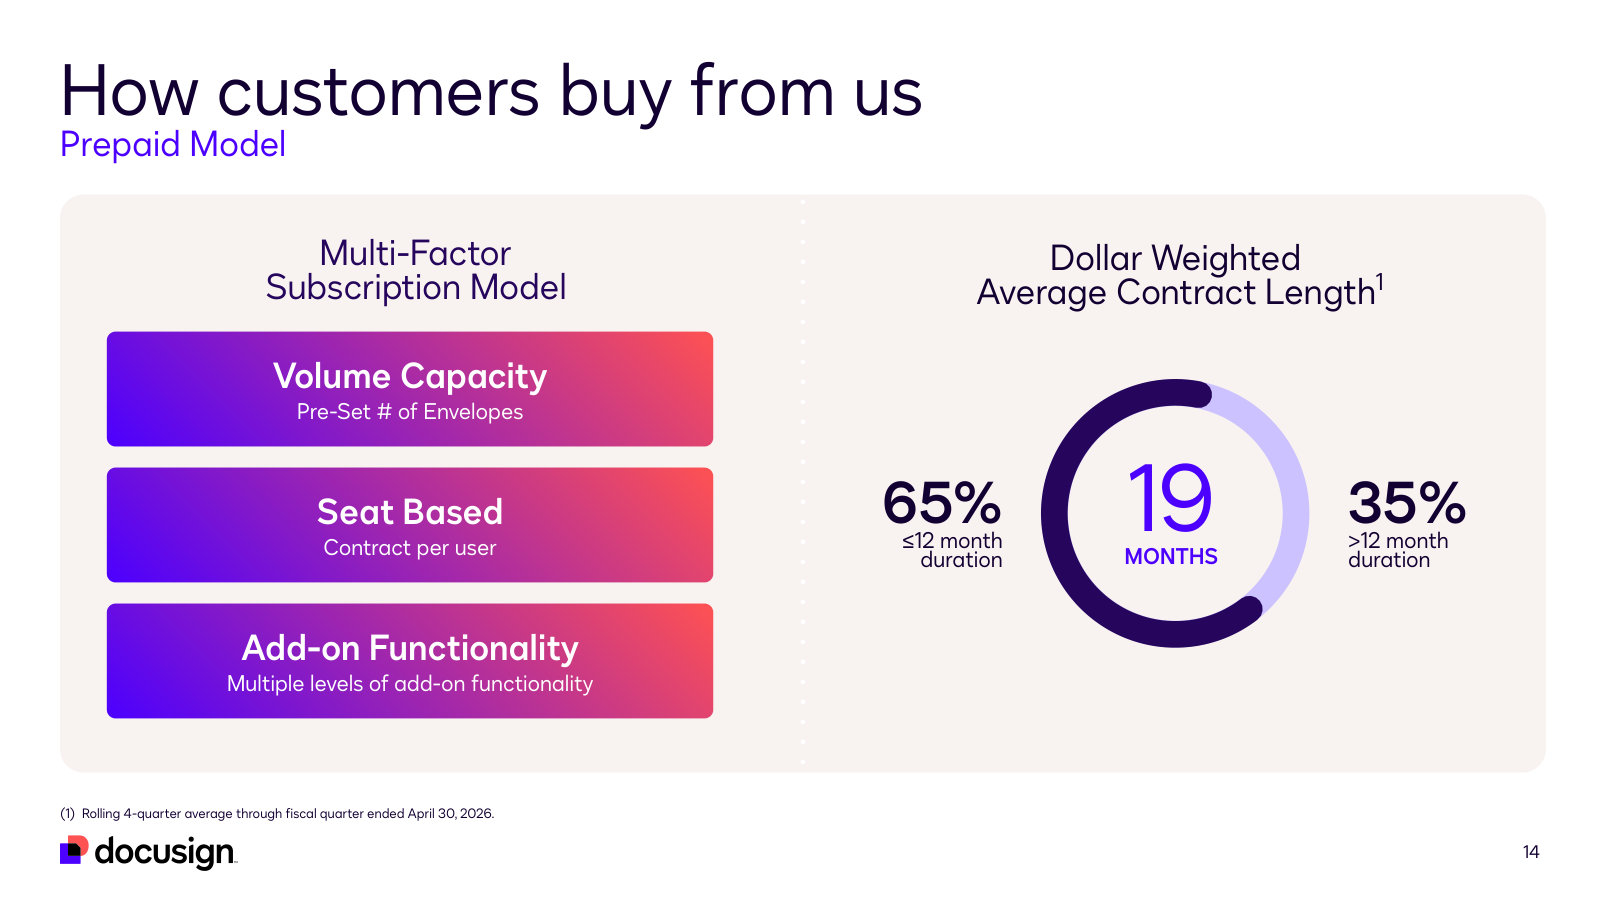
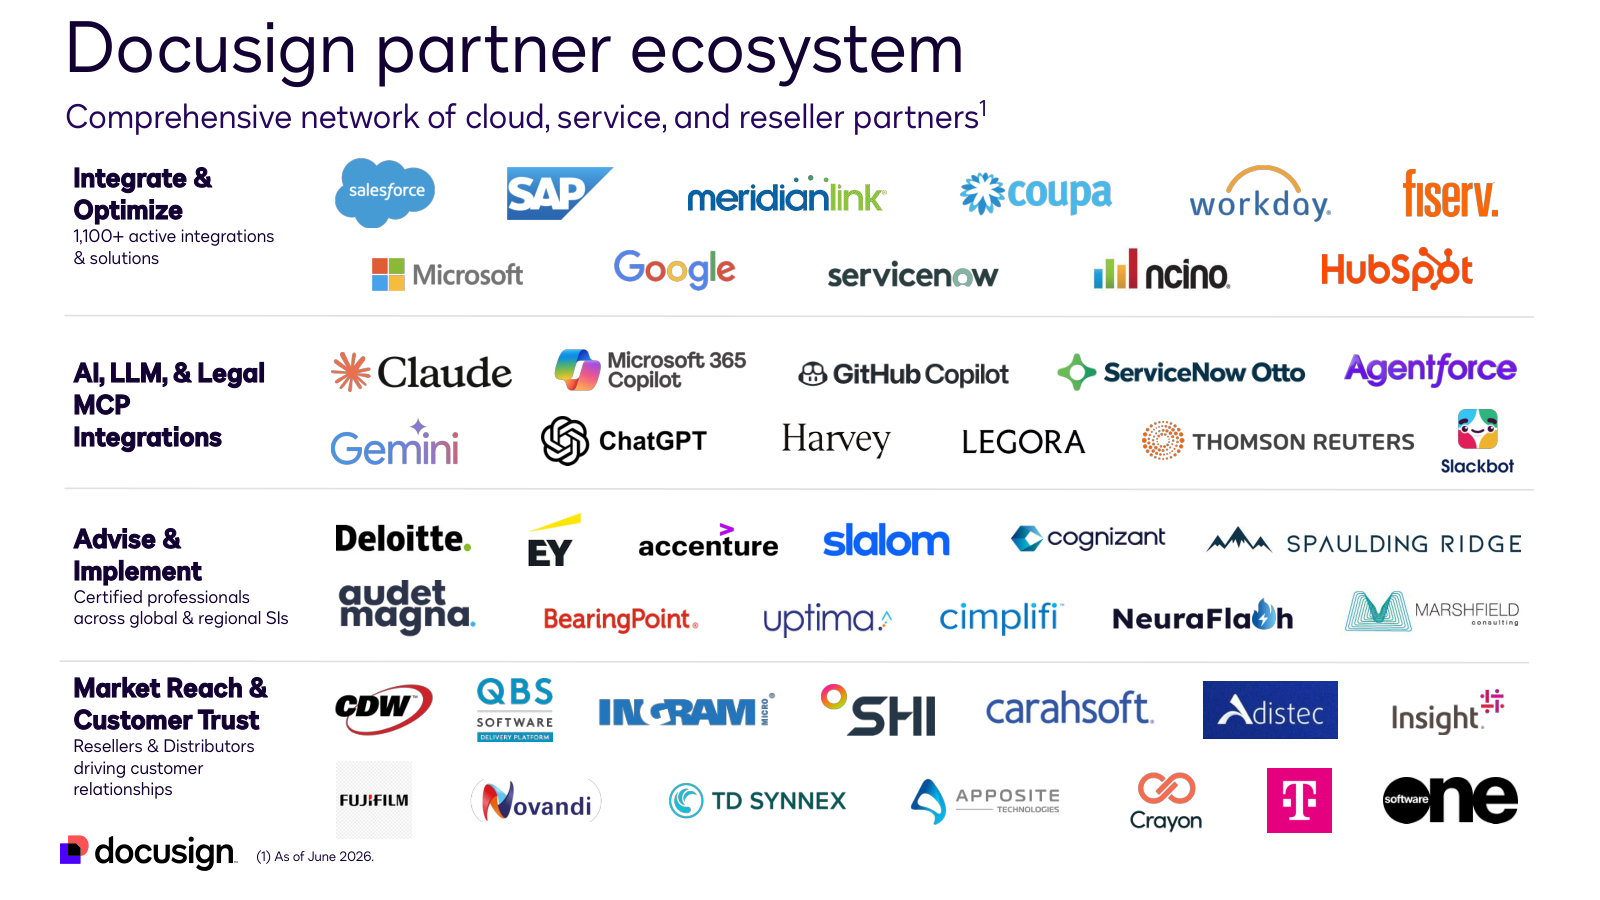
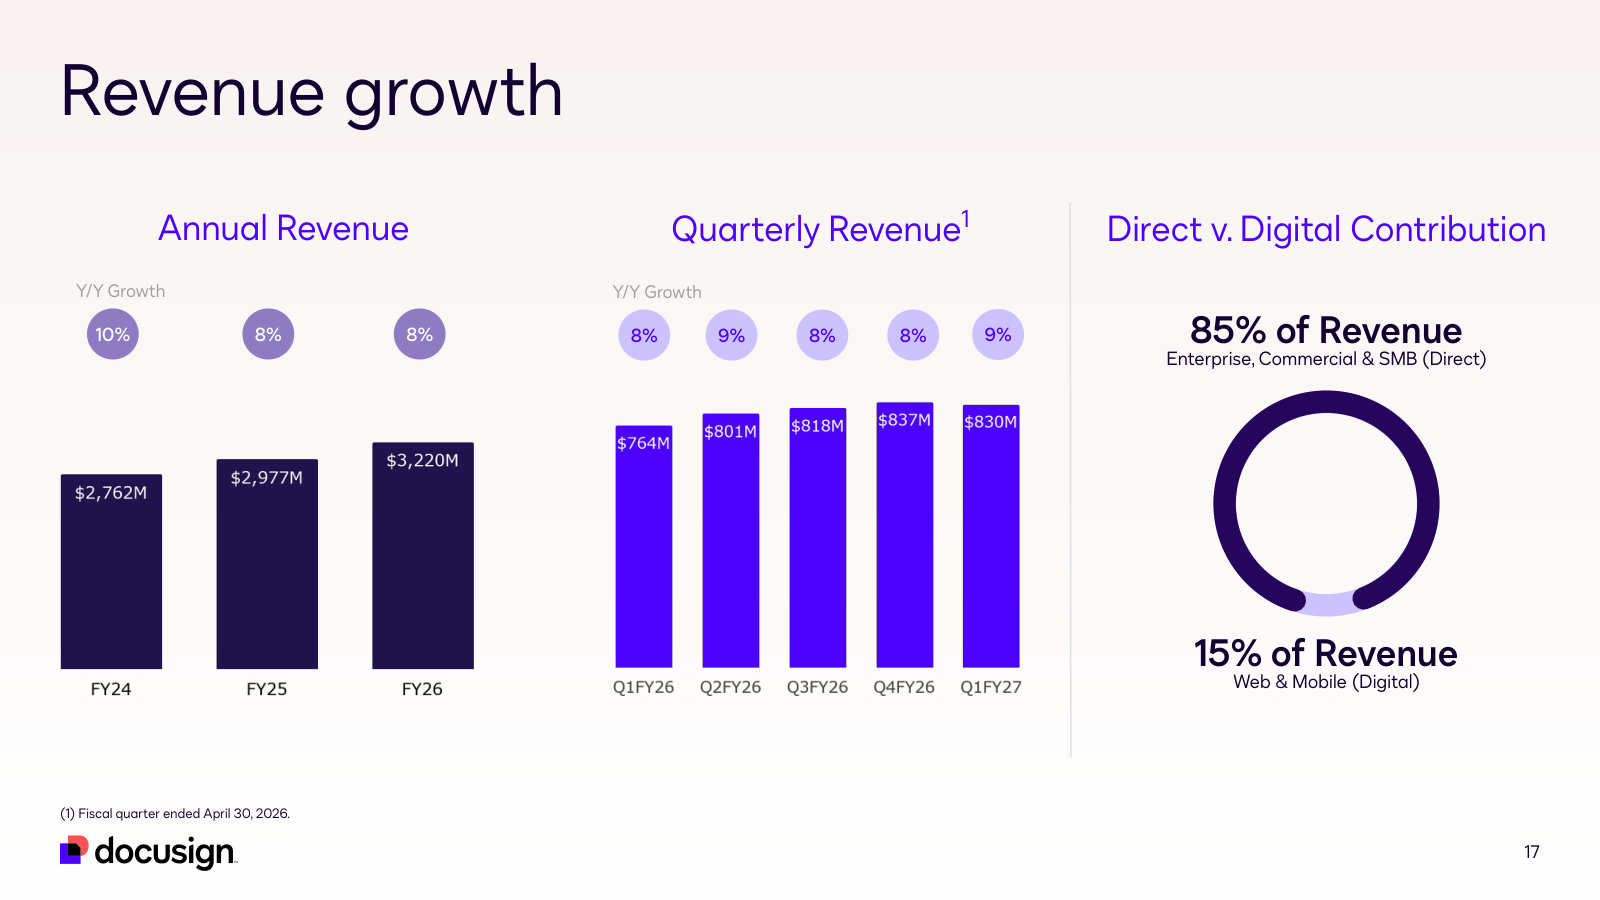
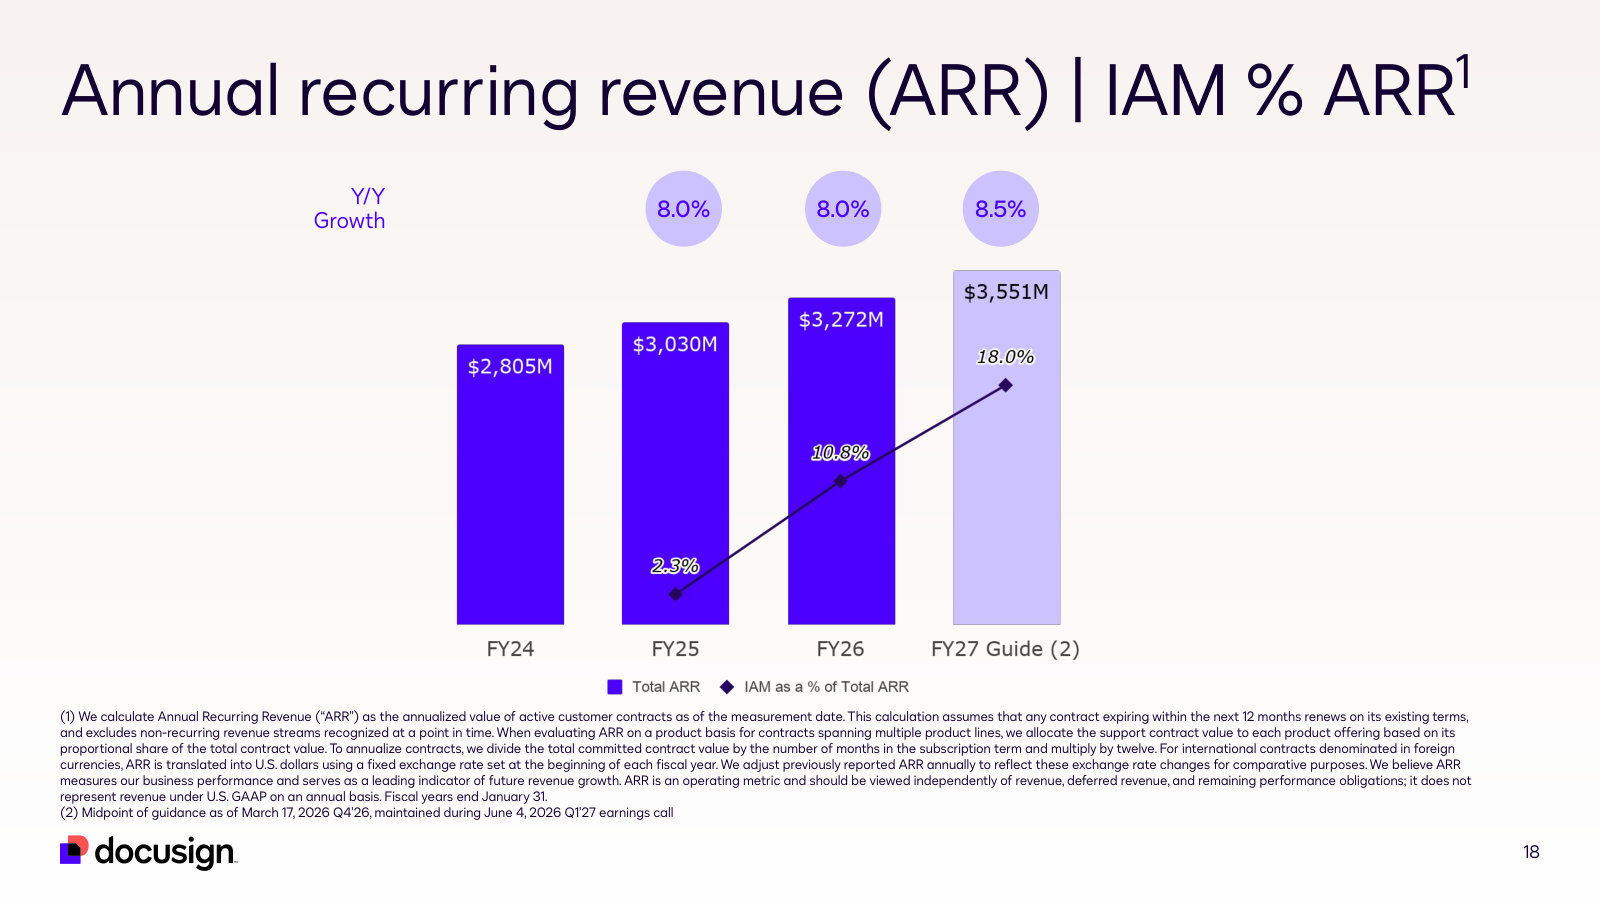
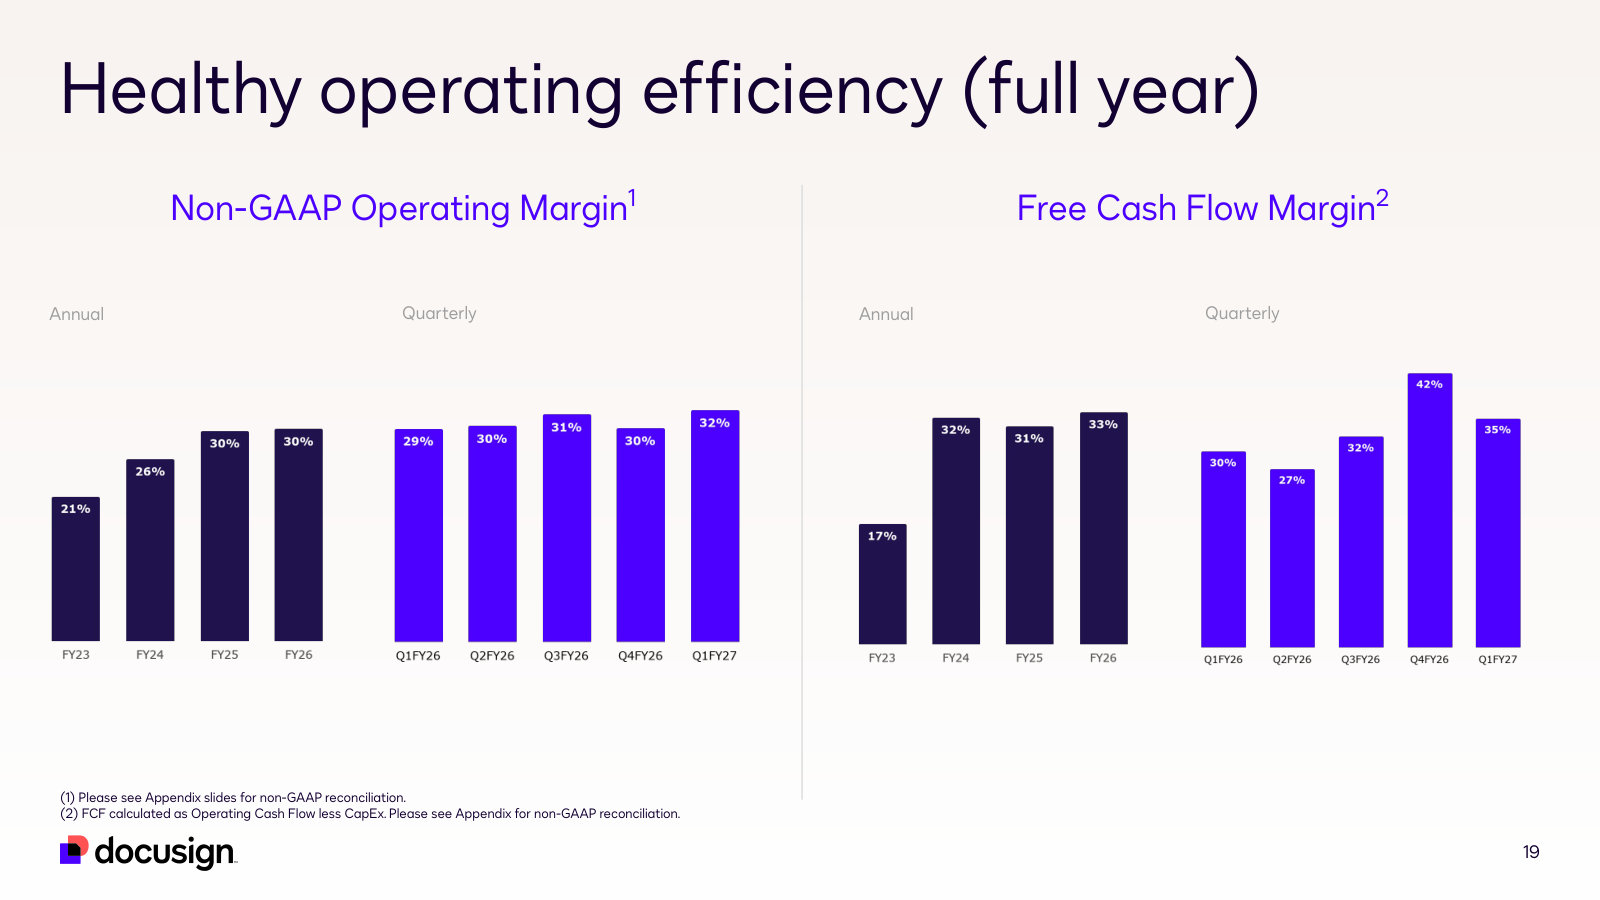
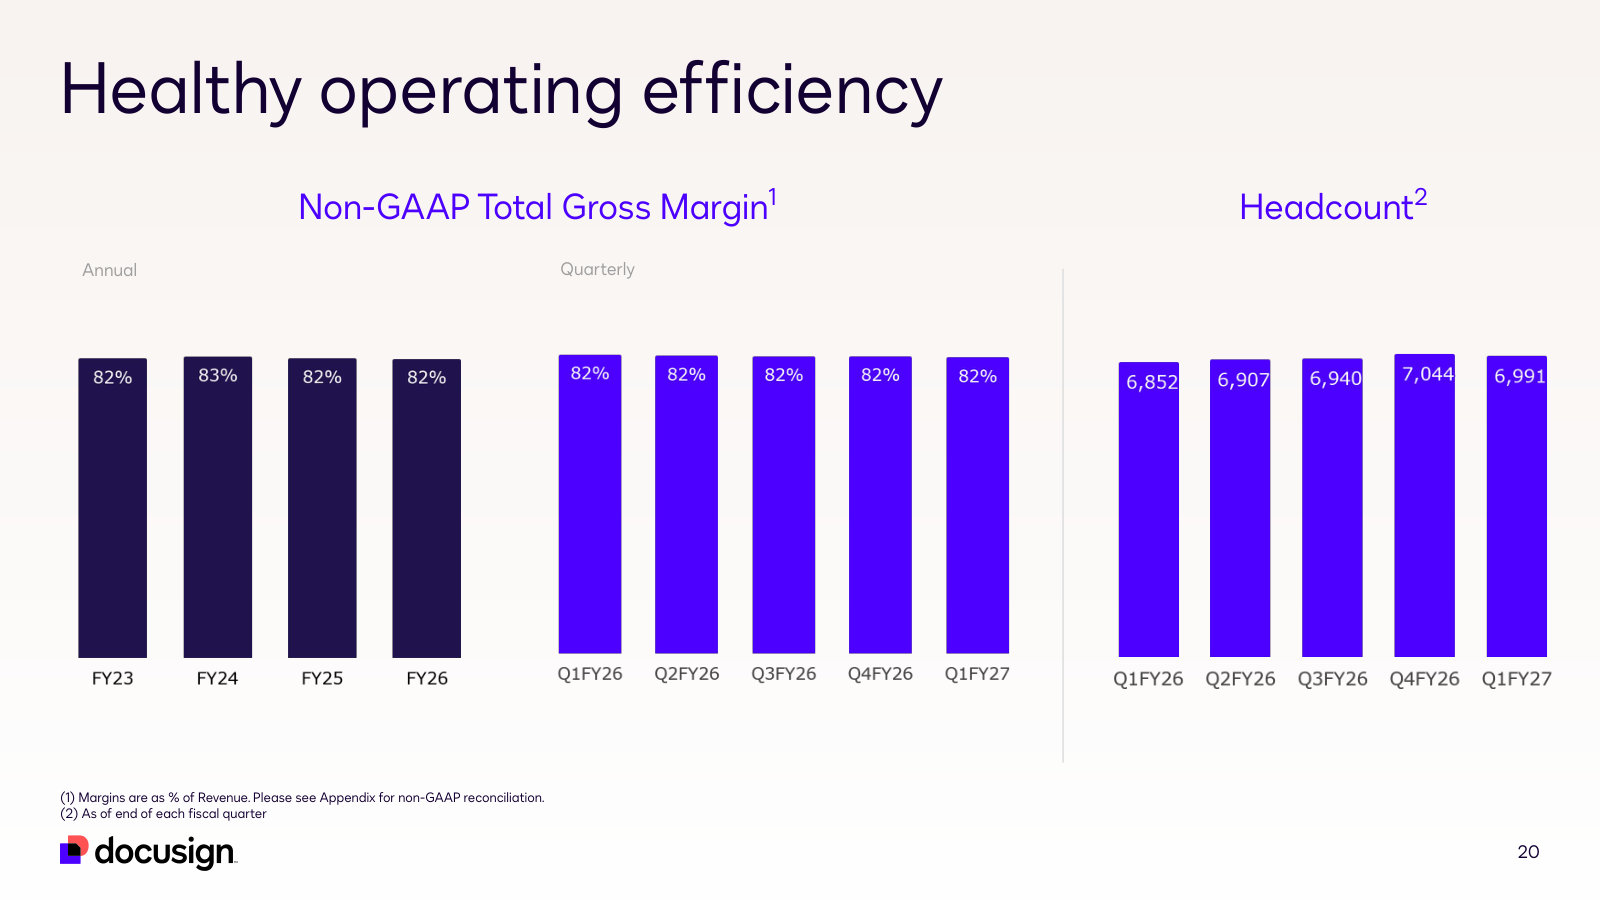
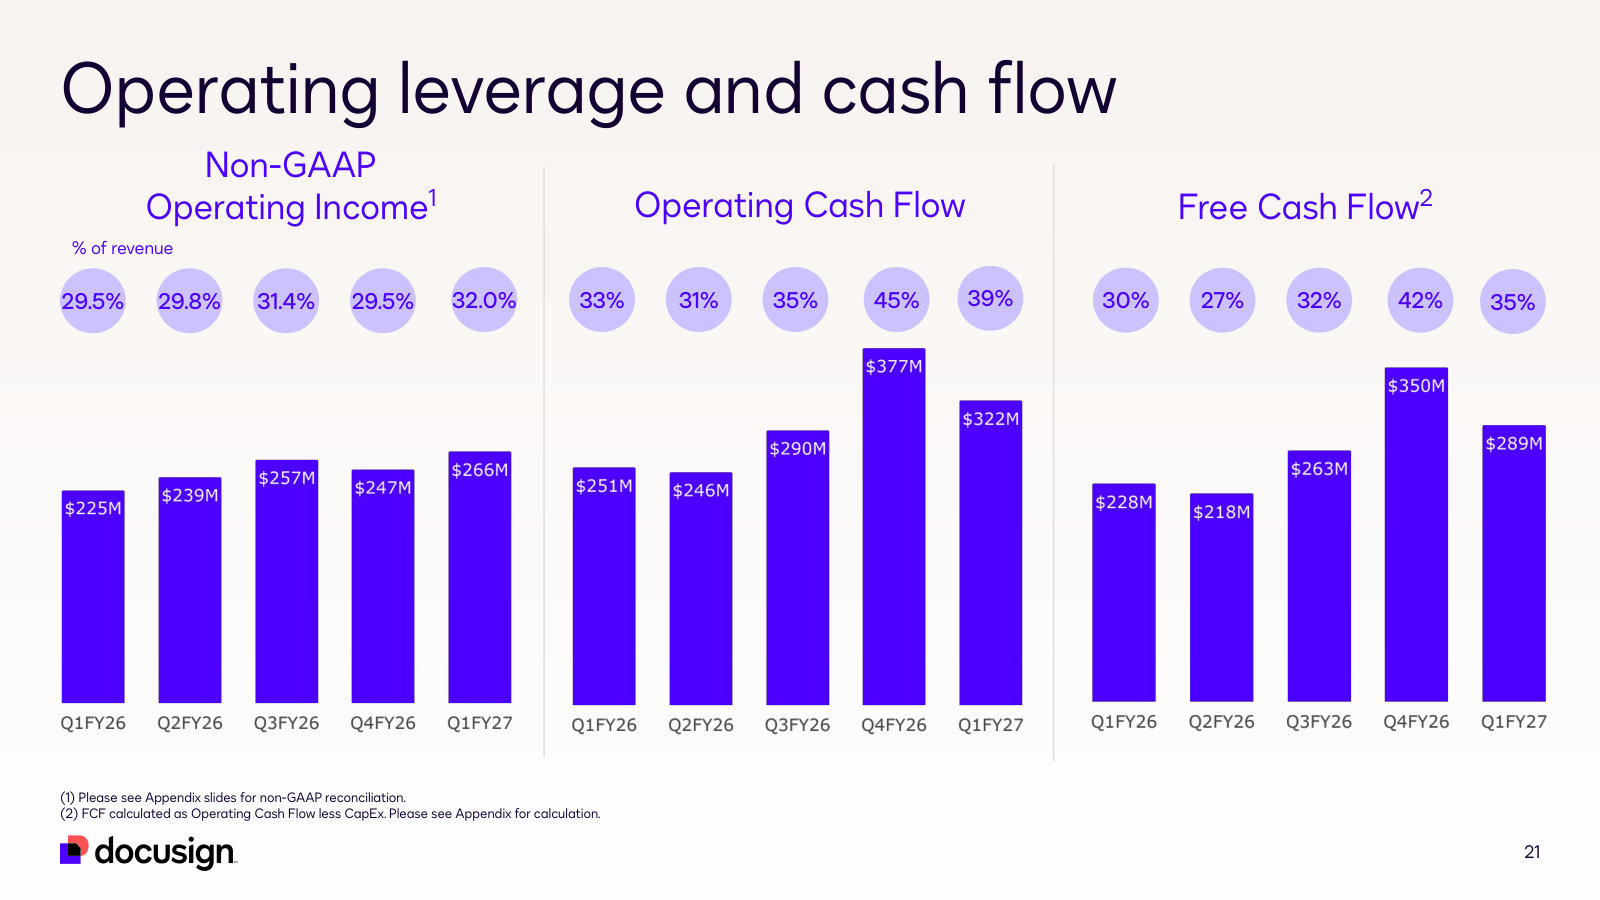
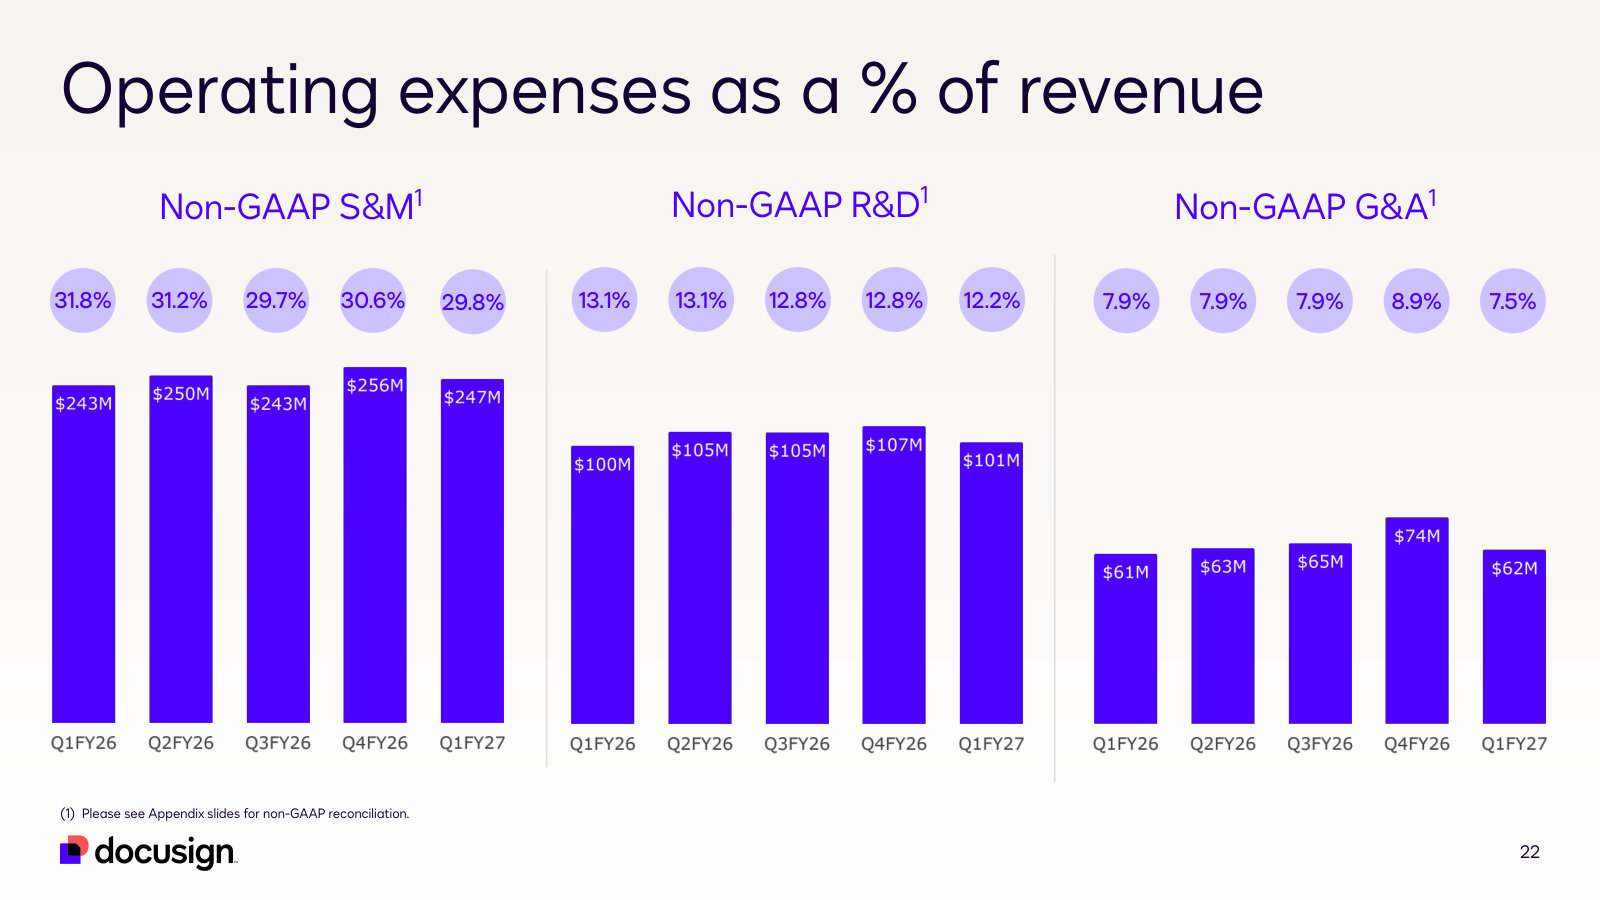
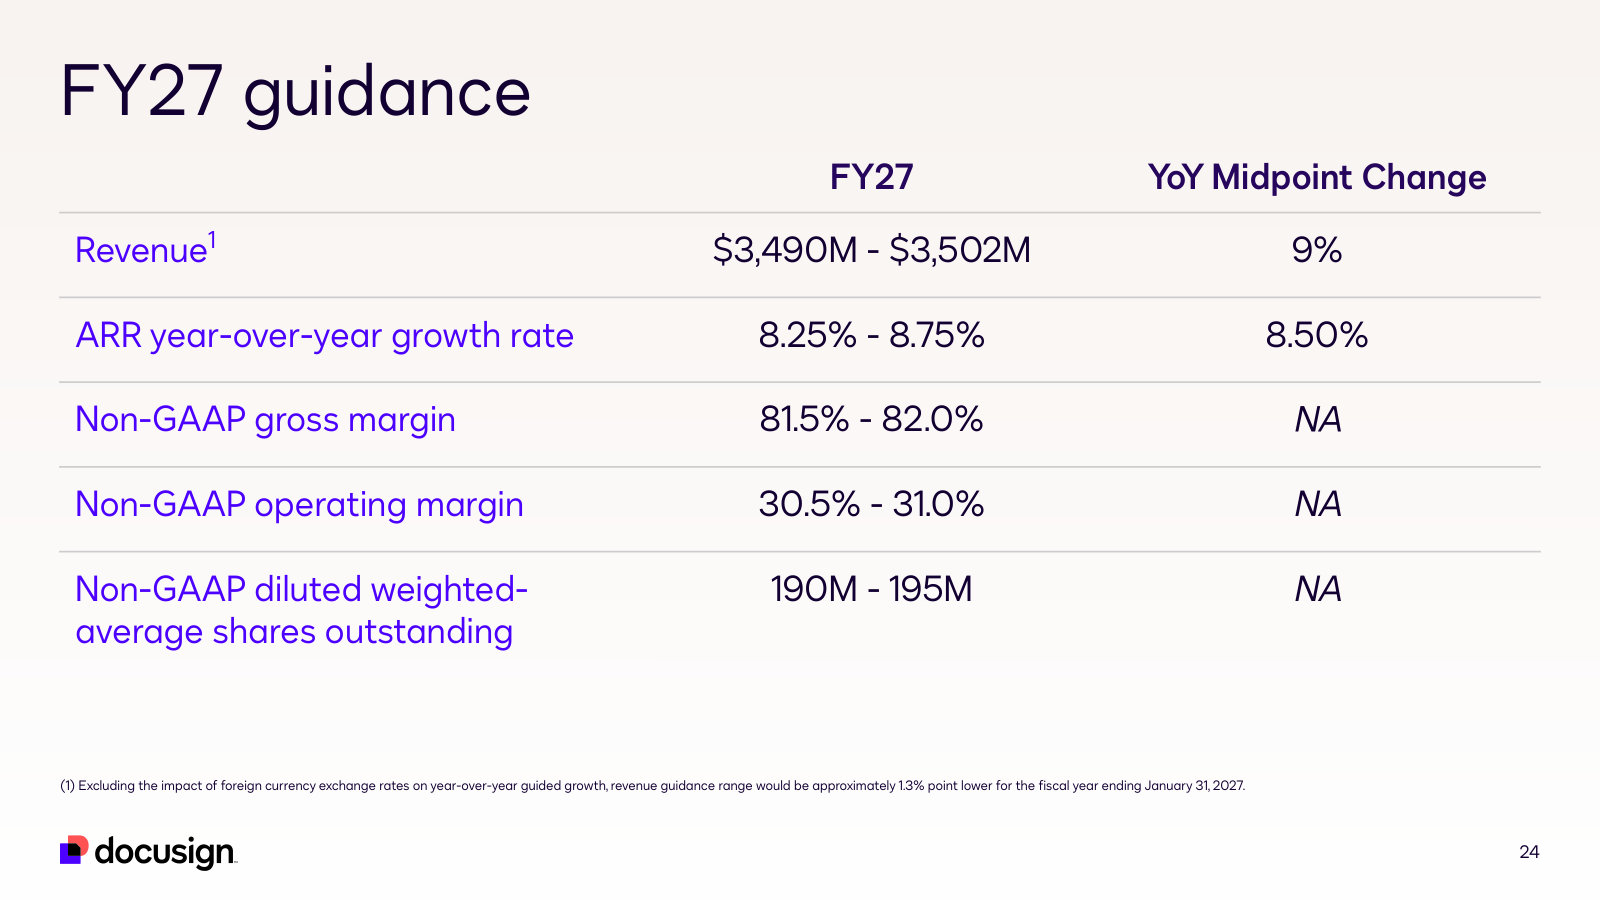
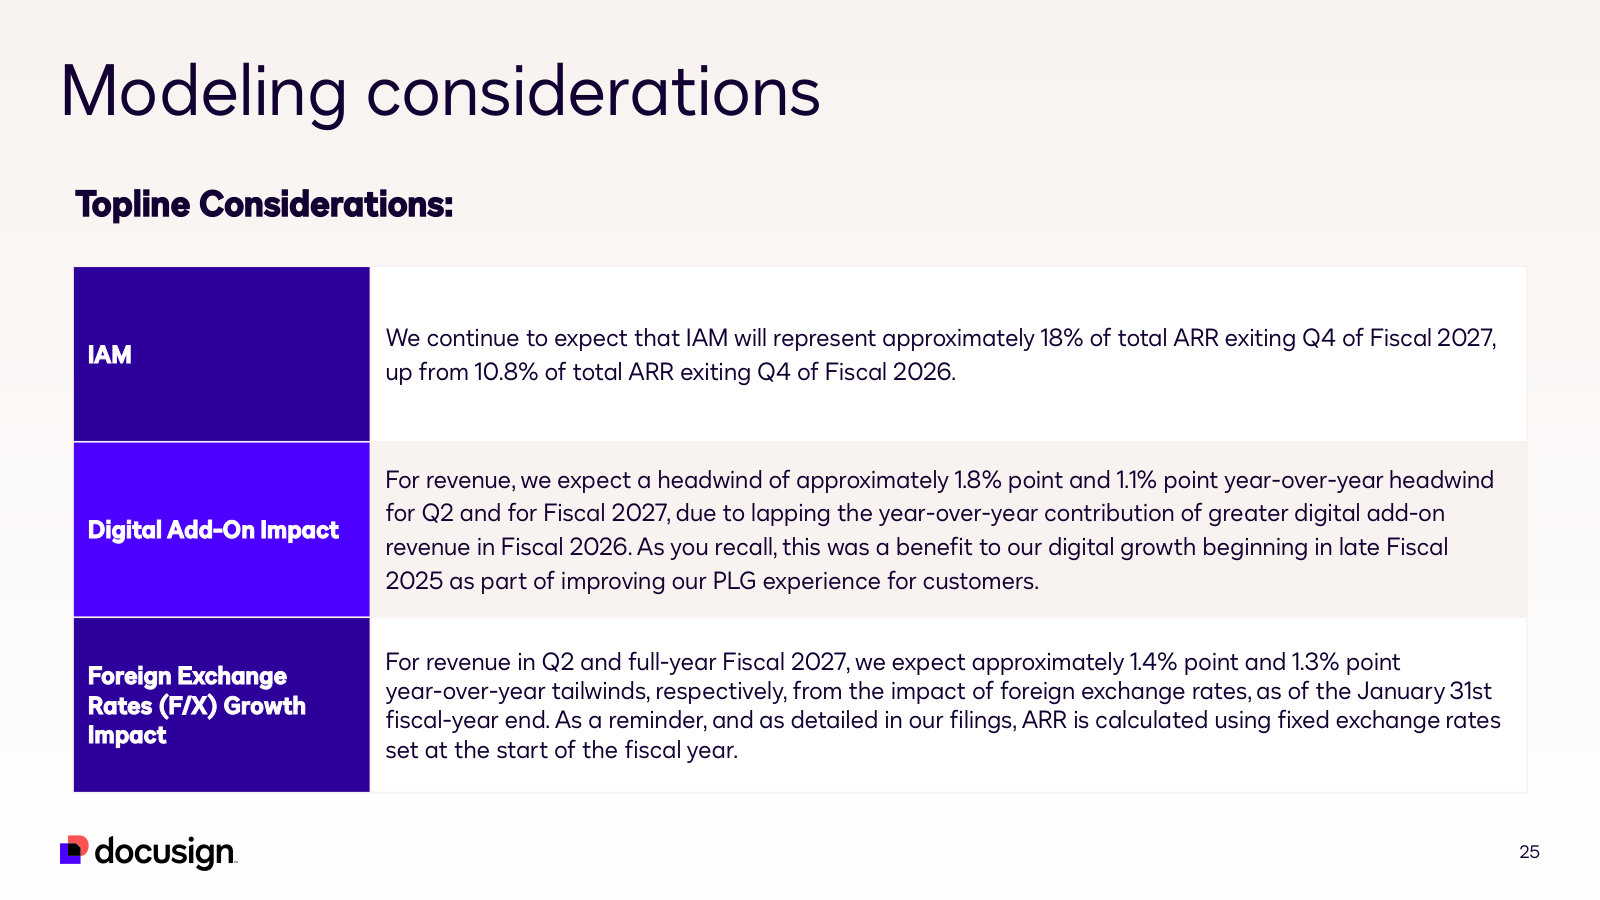
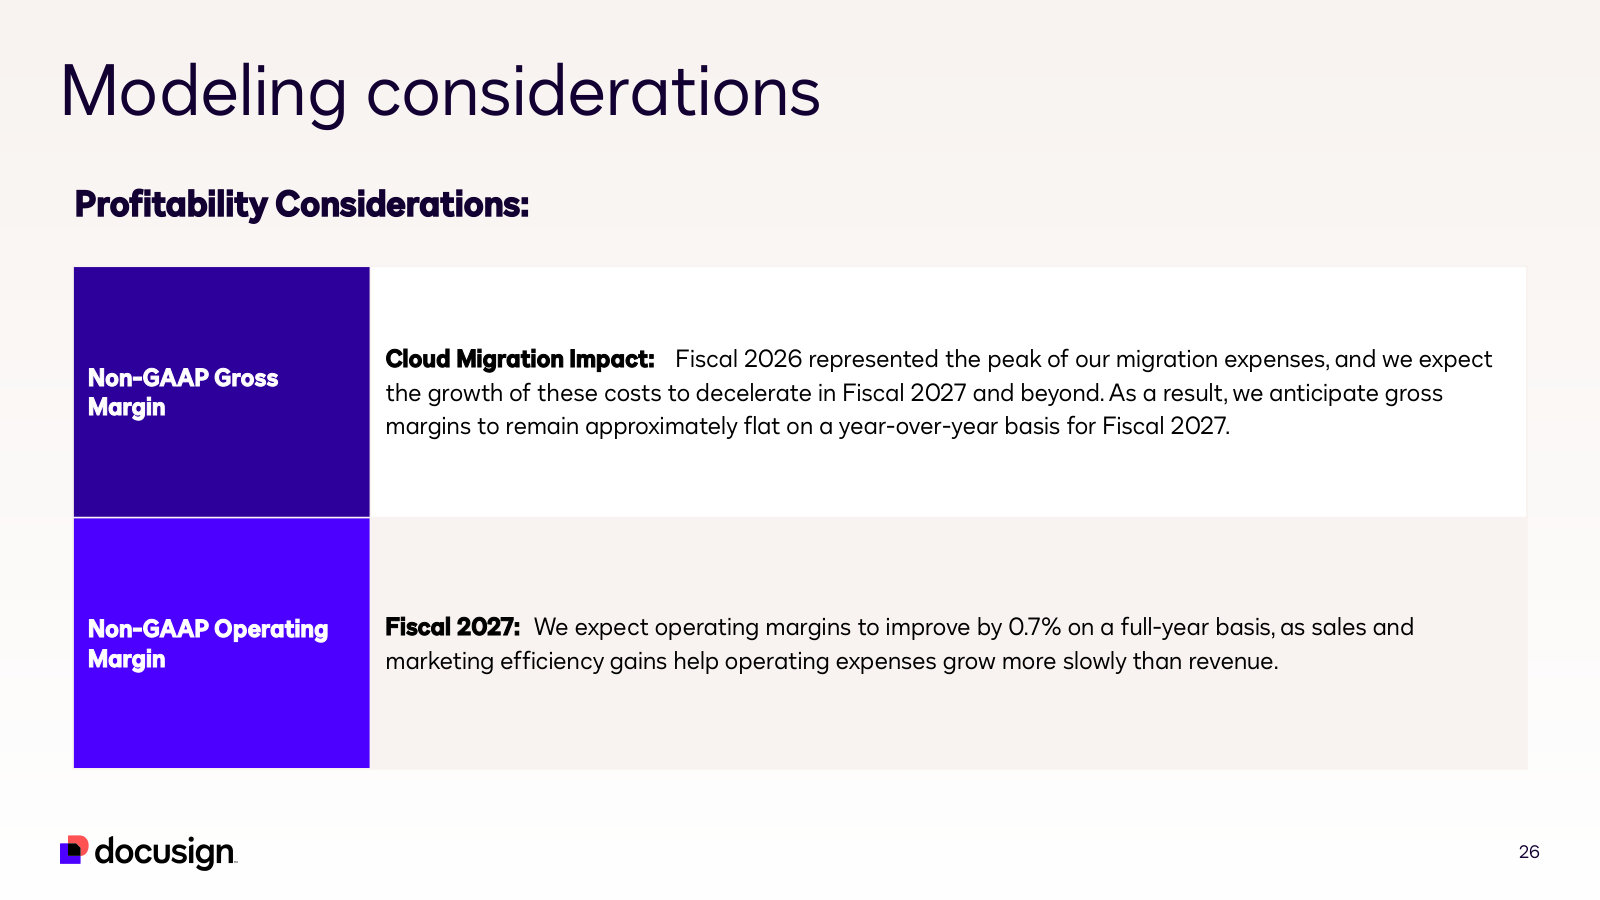
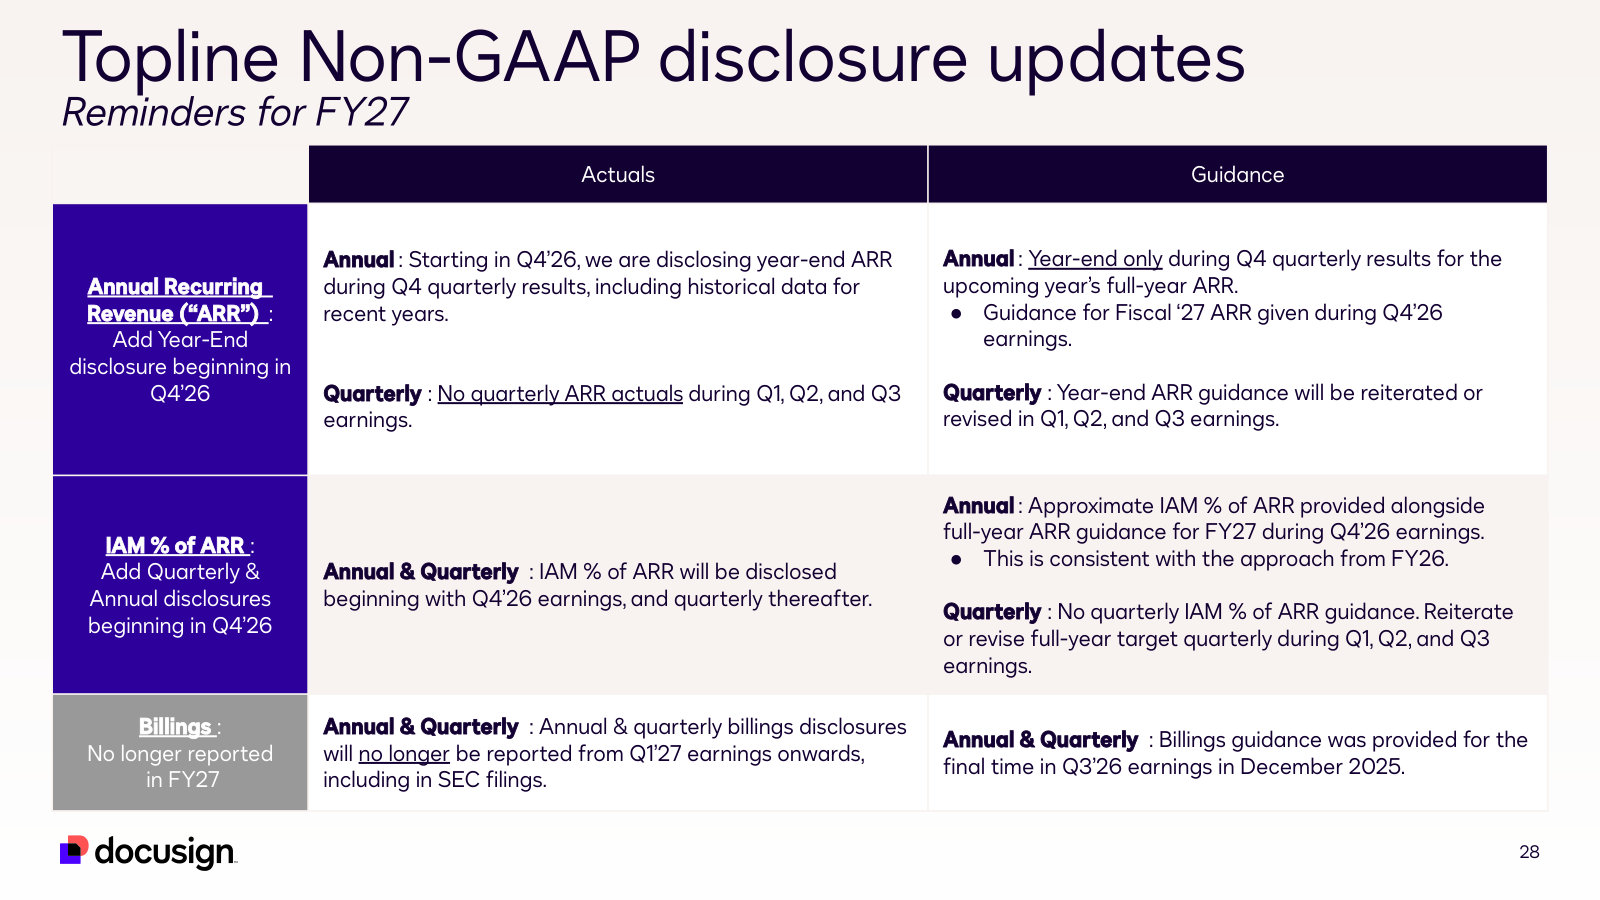
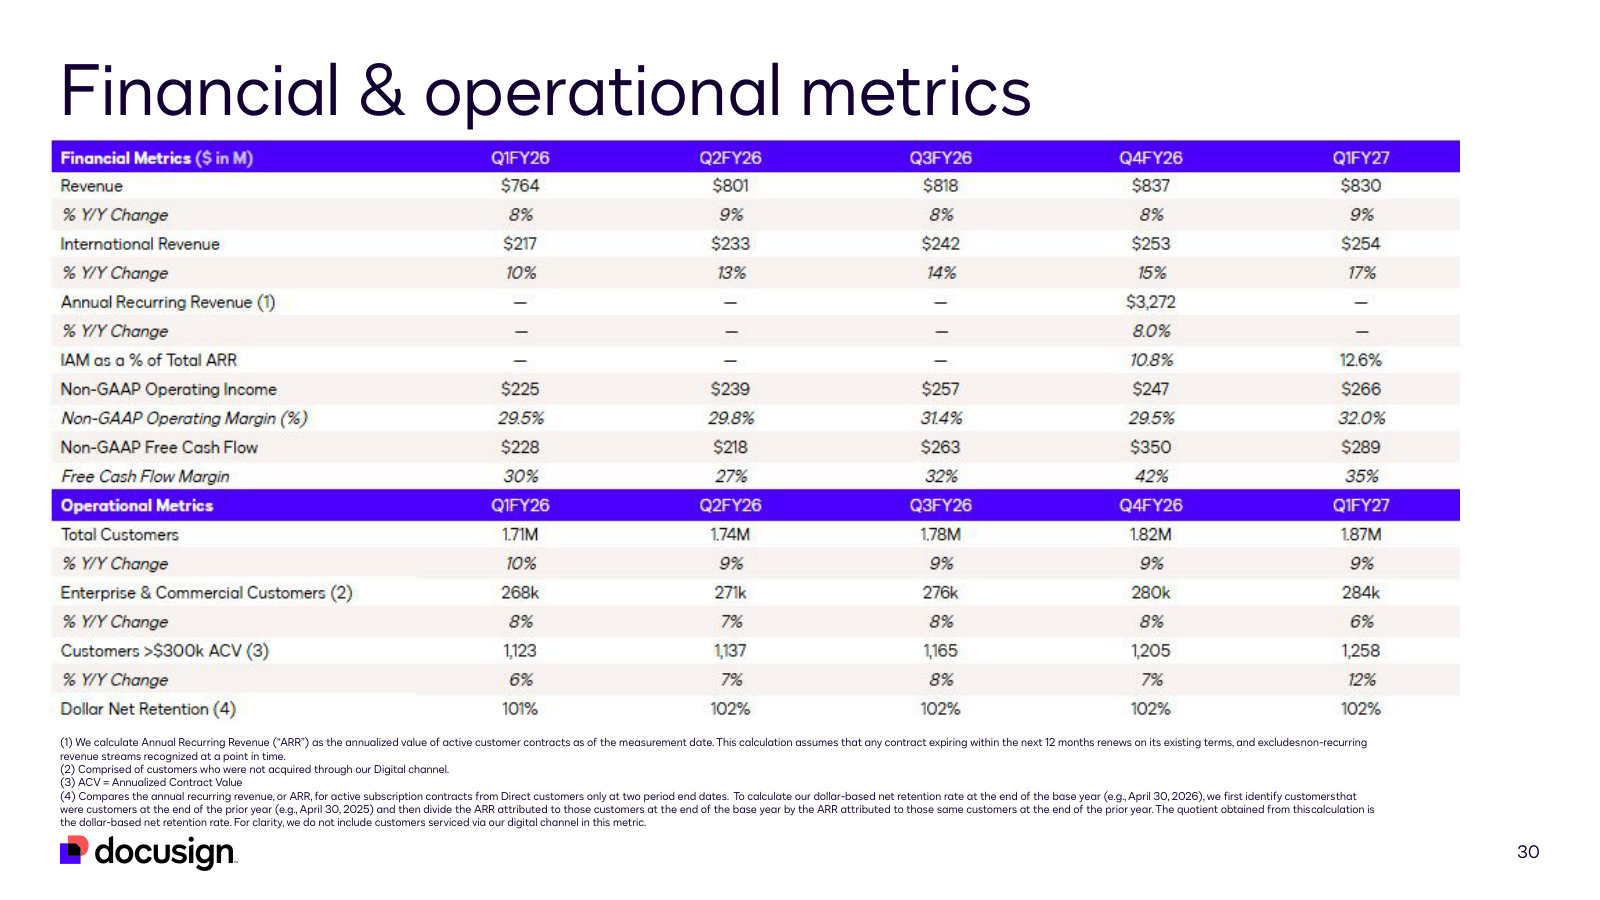
p. 4 — The whole company on one page: ~1.9M customers, $830M quarterly revenue, 32% non-GAAP operating margin, 35% FCF margin. · Open the full presentation →p. 5 — Where agreements sit in a business — sales, HR, service, procurement, marketing, legal. The demand side in one picture. · Open the full presentation →p. 6 — Management's framing of the problem it sells against: fragmented processes, disconnected tools, data locked in signed documents. · Open the full presentation →p. 8 — The IAM platform architecture — Maestro workflows, Navigator repository, App Center, wrapped around create/commit/manage. · Open the full presentation →p. 9 — Three eras in one chart: e-signature (2003-17), negotiation and CLM (2018-23), agreement data and AI today. · Open the full presentation →p. 10 — The product surface step by step, with the integration list that matters — Salesforce, SAP Ariba, Coupa, and the LLM vendors. · Open the full presentation →p. 11 — The land-and-expand thesis drawn as a maturity curve: 40K IAM customers today, the value gap is the upsell runway. · Open the full presentation →p. 12 — How a signer becomes a paying enterprise account — the funnel behind digital versus direct revenue. · Open the full presentation →p. 13 — Geography: 31% of revenue international, growing 17%, with the three-tier market prioritization behind it. · Open the full presentation →p. 14 — Unit economics of a contract — envelope volume, seats and add-ons, 19-month dollar-weighted average contract length. · Open the full presentation →p. 15 — The partner and integration ecosystem, including the AI and MCP integrations added in the last year. · Open the full presentation →p. 17 — Revenue by year and quarter, growth settled at 8-9%, plus the 85/15 split between direct and self-serve digital. · Open the full presentation →p. 18 — ARR and the IAM mix — 10.8% of ARR exiting FY26, guided to 18% exiting FY27. The single number the transition turns on. · Open the full presentation →p. 19 — Full-year operating and free cash flow margins since FY23 — the margin expansion that has offset slowing growth. · Open the full presentation →p. 20 — Gross margin flat at 82% and headcount roughly level near 7,000 — where the operating leverage does and doesn't come from. · Open the full presentation →p. 21 — Quarterly operating income, operating cash flow and free cash flow, with the seasonal Q4 cash spike visible. · Open the full presentation →p. 22 — Opex mix: sales and marketing near 30% of revenue, R&D ~12%, G&A ~8%. Where the money goes. · Open the full presentation →p. 24 — FY27 guidance — $3.49-3.50B revenue, 8.5% ARR growth, 30.5-31.0% operating margin. The bar management set for itself. · Open the full presentation →p. 25 — Topline modeling detail: the IAM ramp, a 1.1pt digital add-on headwind from lapping FY26, and FX tailwinds. · Open the full presentation →p. 26 — Profitability detail: FY26 was the peak of cloud migration expense; margins improve on S&M efficiency, not gross margin. · Open the full presentation →p. 28 — Disclosure changes worth knowing: billings is no longer reported from Q1 FY27; ARR and IAM % of ARR replace it. · Open the full presentation →p. 30 — The metrics table — total and enterprise customers, customers above $300k ACV, and 102% dollar net retention. · Open the full presentation →
The deck from the IAM launch year and the last generation to size the market — the addressable-market case newer decks drop. · Open the full document →
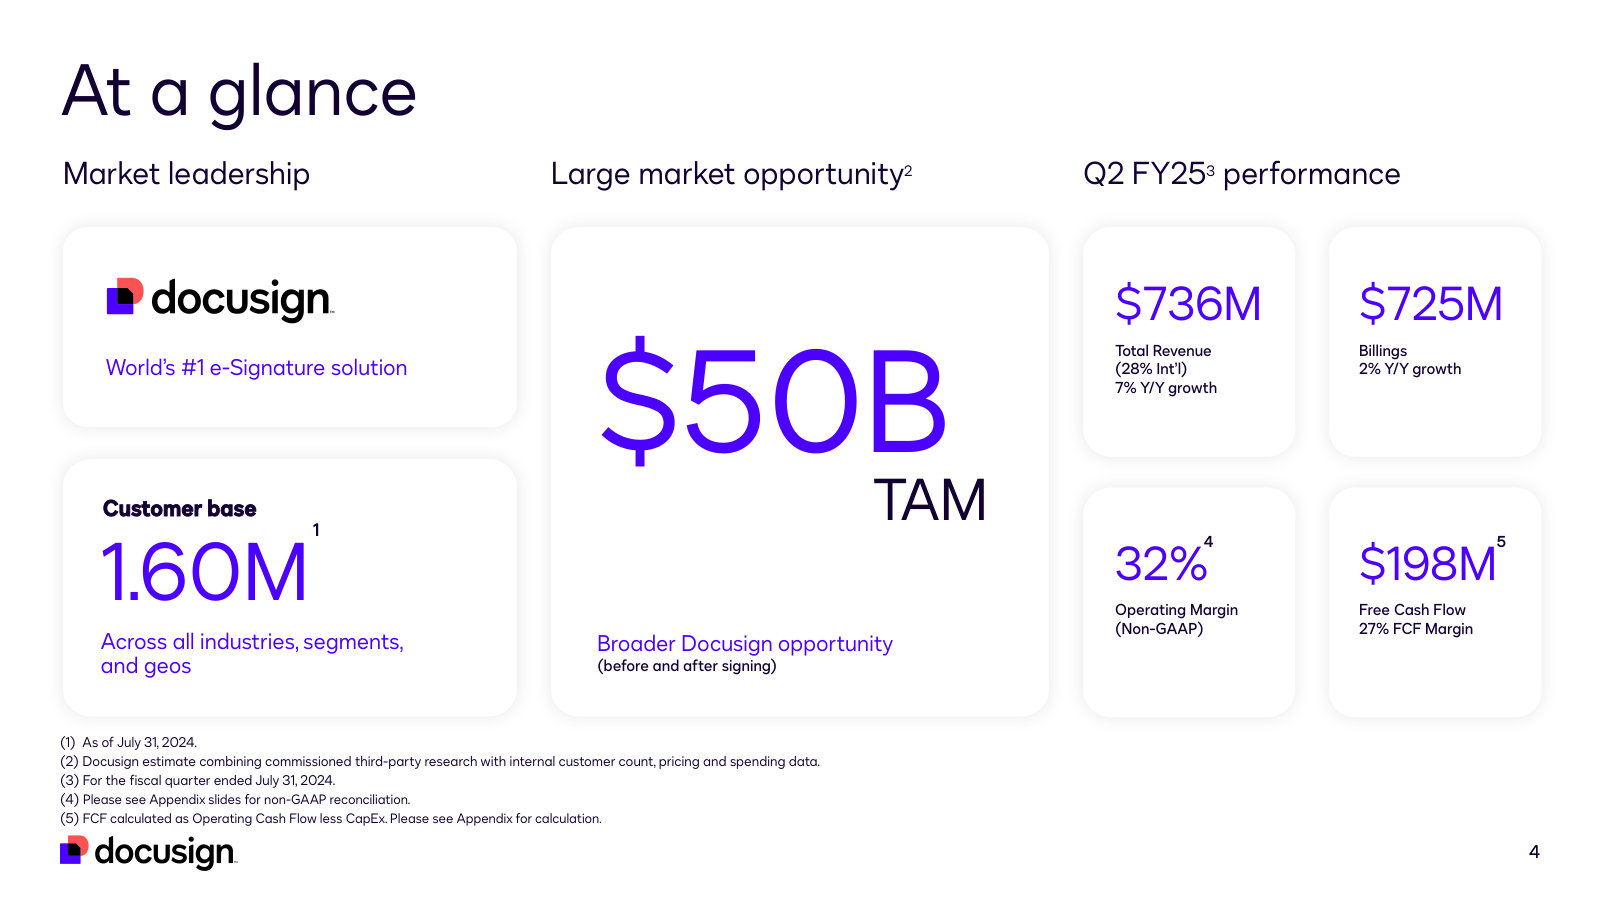
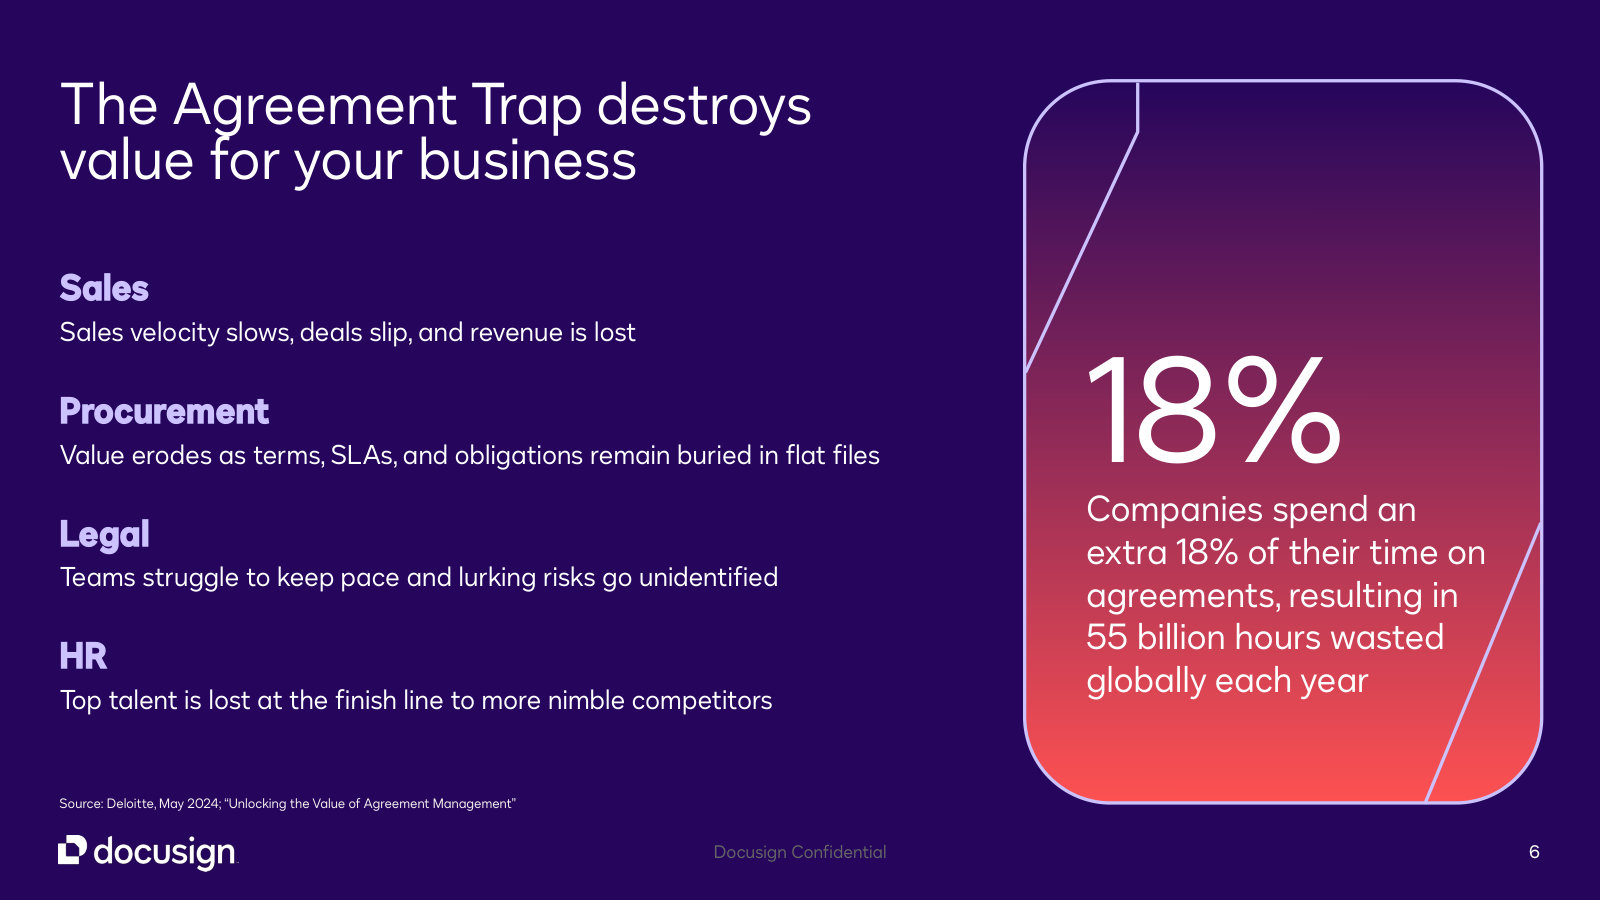
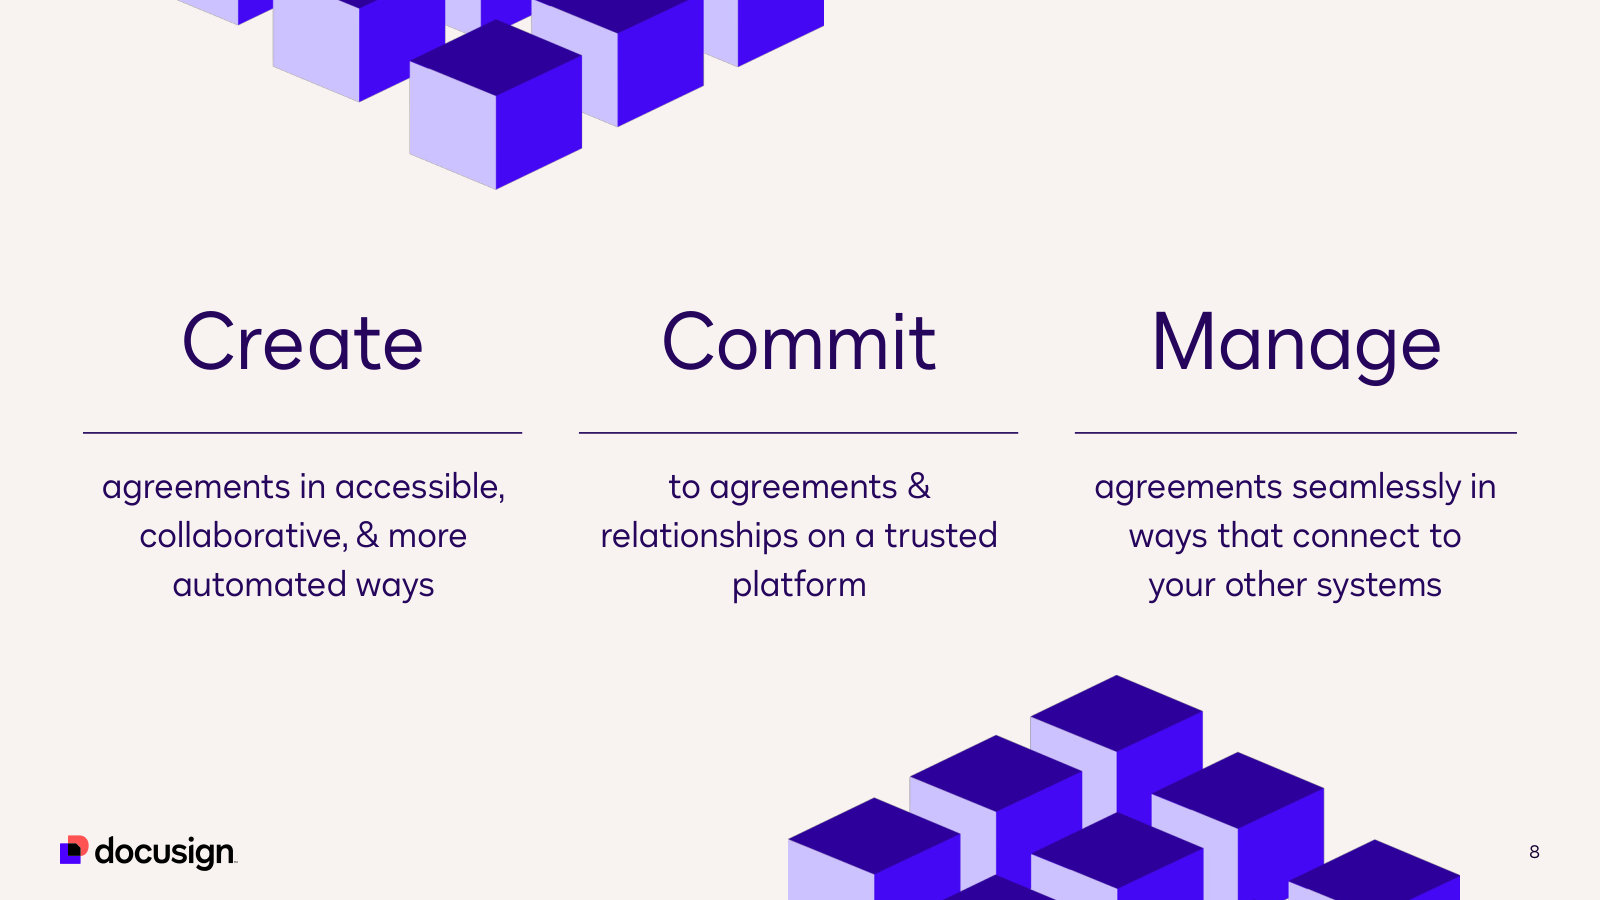
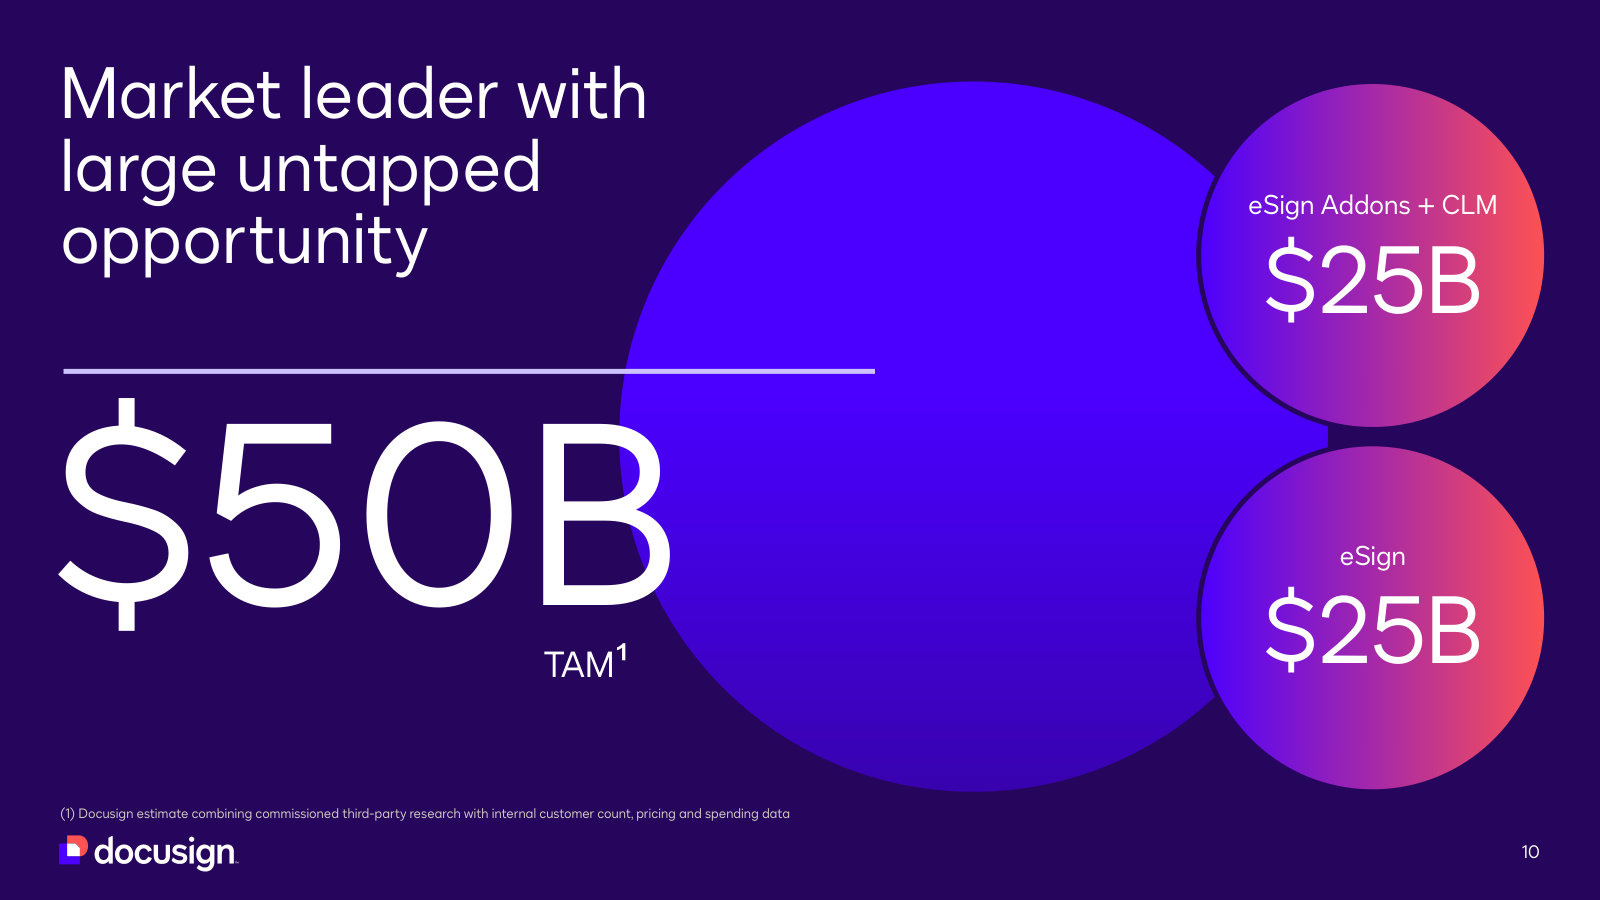
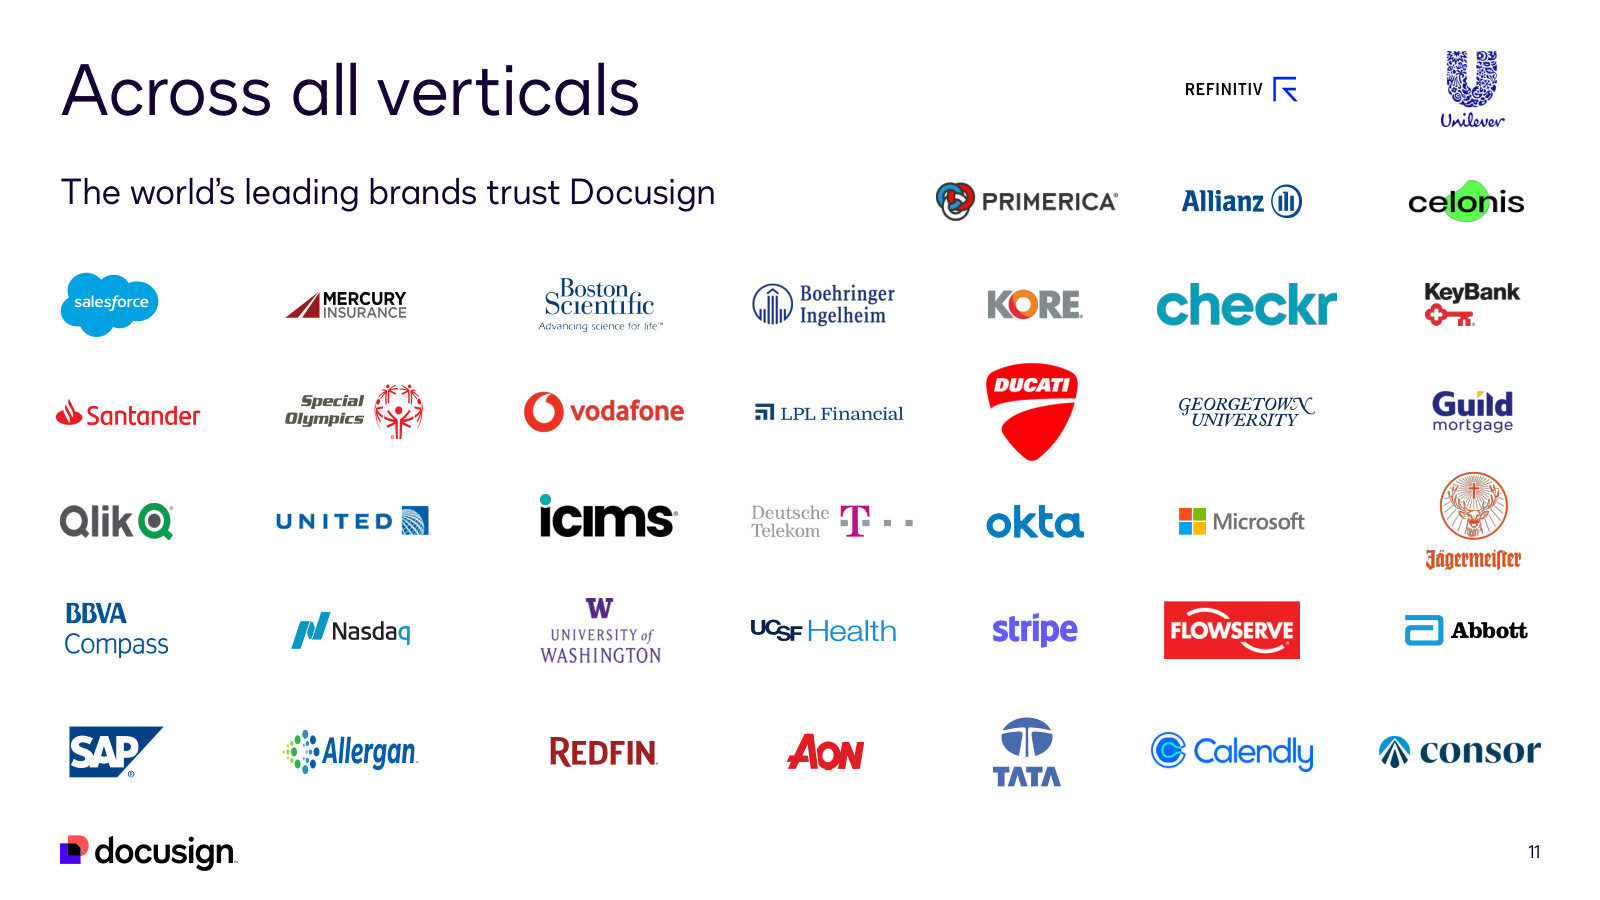
p. 4 — The company as it looked at the IAM launch: 1.60M customers, $736M revenue growing 7%, billings up 2%, a $50B TAM claim. · Open the full presentation →p. 6 — The problem quantified — Deloitte's estimate that companies lose 18% of their time to agreements, 55 billion hours a year. · Open the full presentation →p. 8 — Create, commit, manage: the three-verb vocabulary the whole IAM product line is organized around. · Open the full presentation →p. 10 — Management's market sizing: $50B split evenly between core e-signature and the add-ons plus CLM it is expanding into. · Open the full presentation →p. 11 — The customer list across verticals — Salesforce, Santander, Unilever, Microsoft, T-Mobile — evidence of enterprise reach. · Open the full presentation →
The pre-IAM e-signature company, and the last deck to disclose cohorts and net retention as growth slowed. · Open the full document →
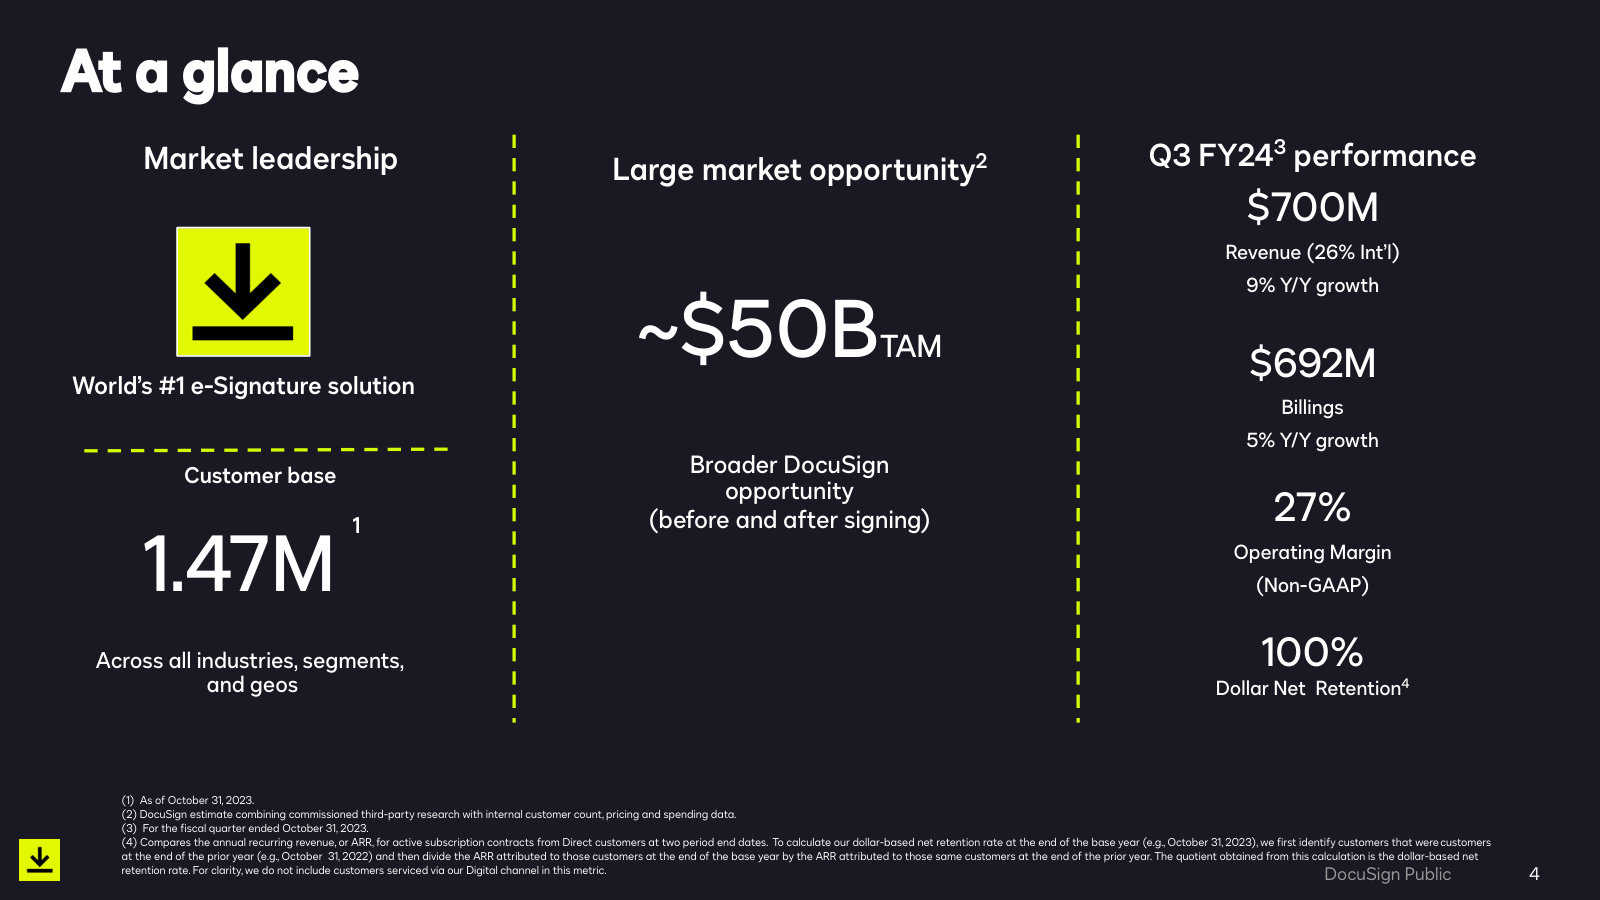
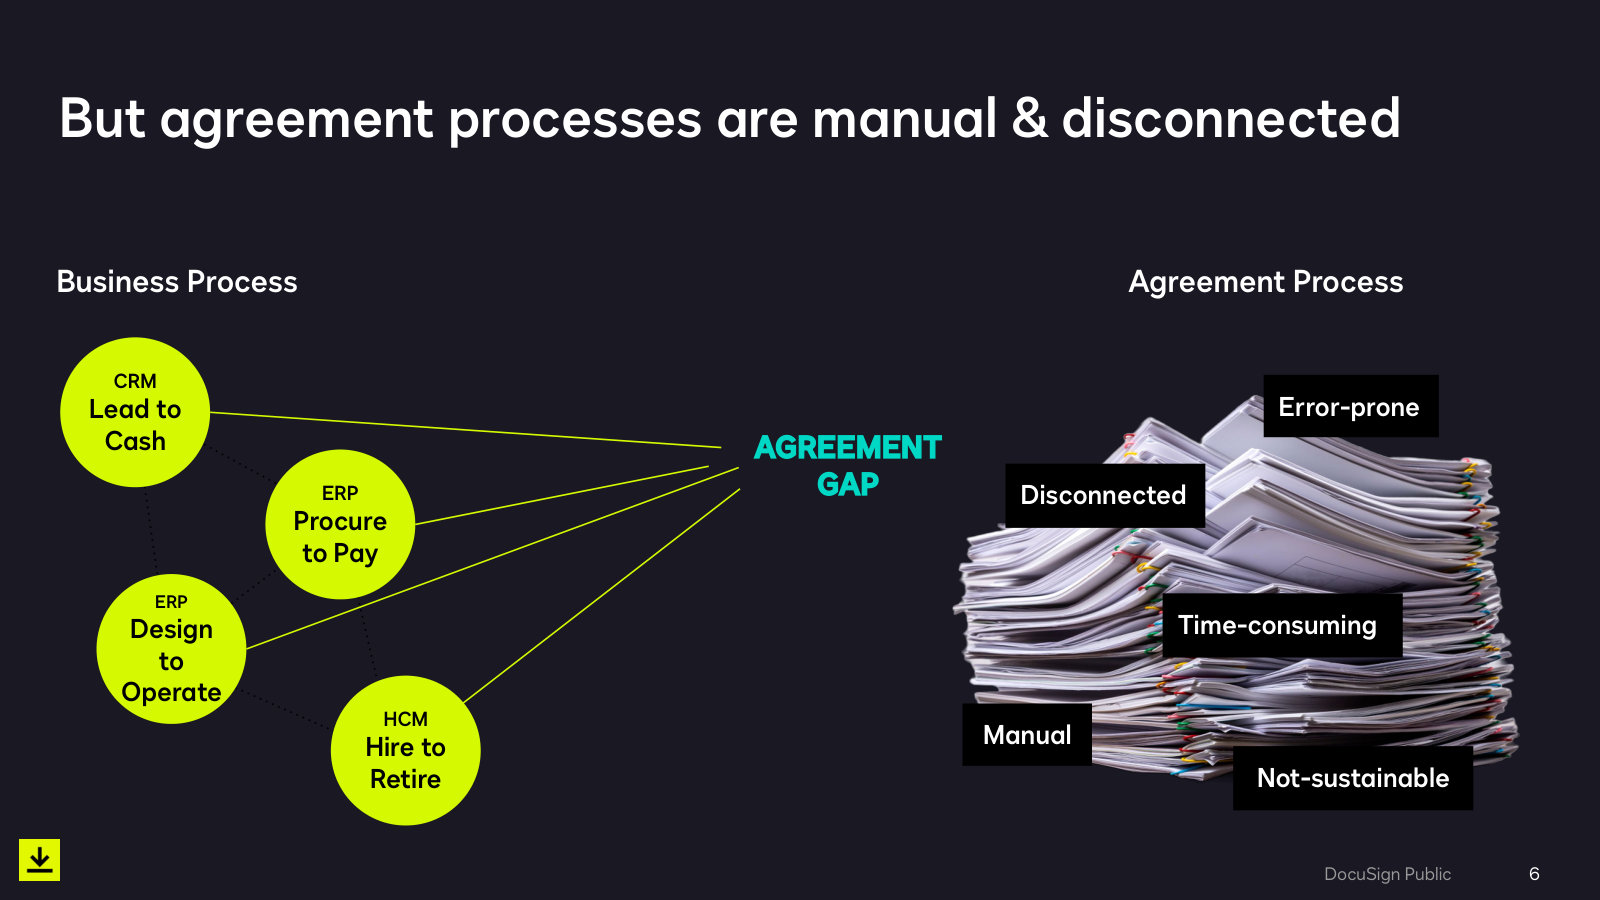
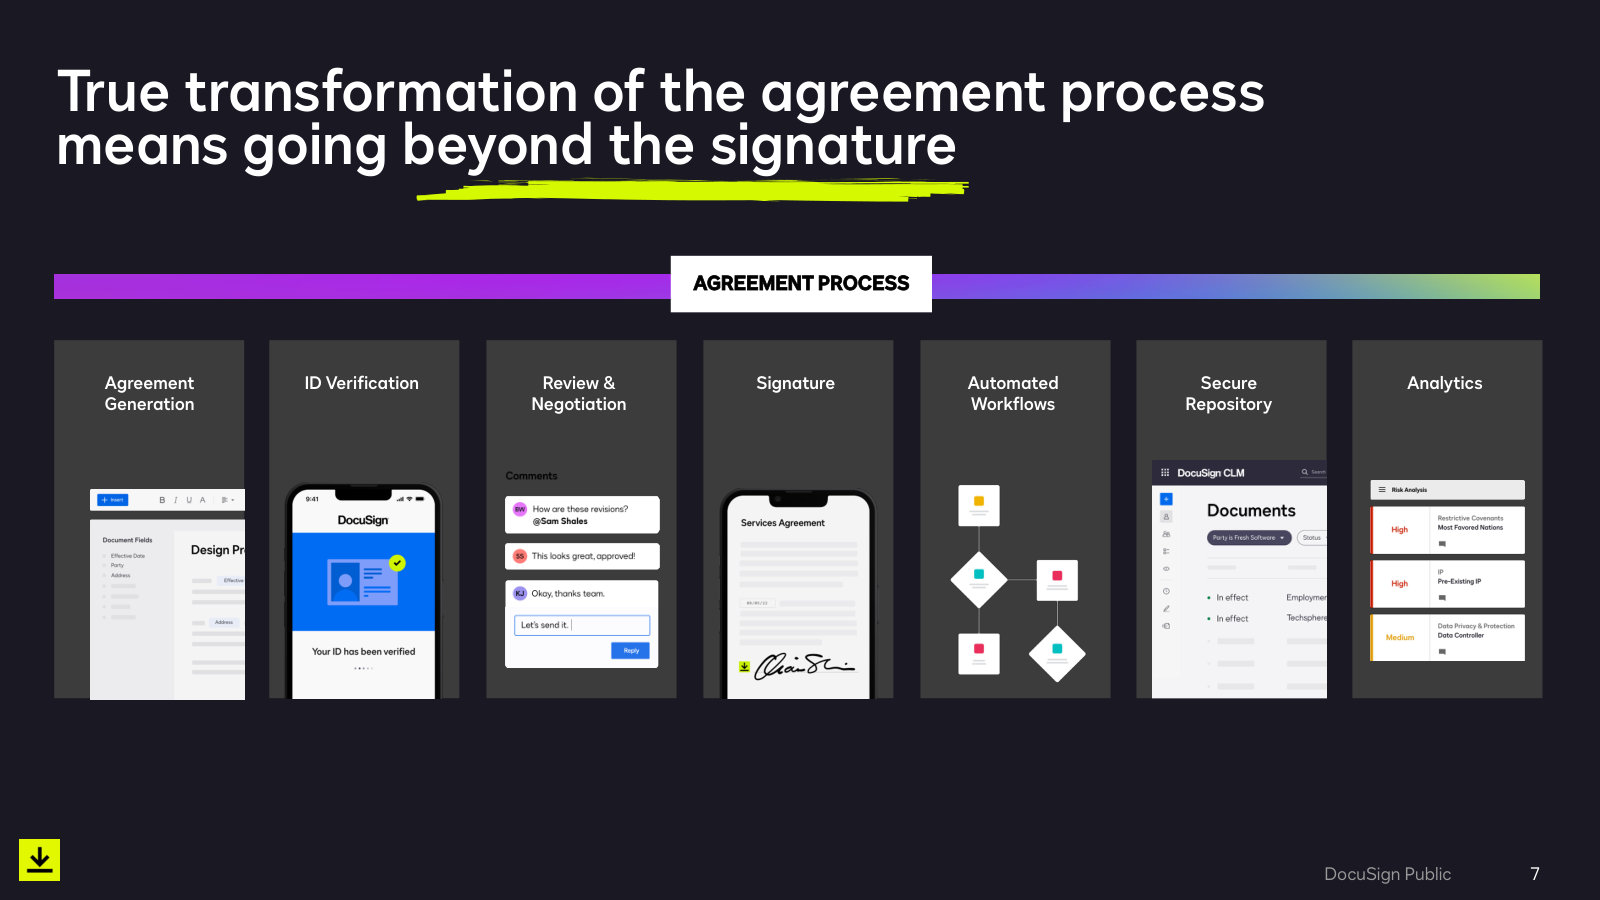
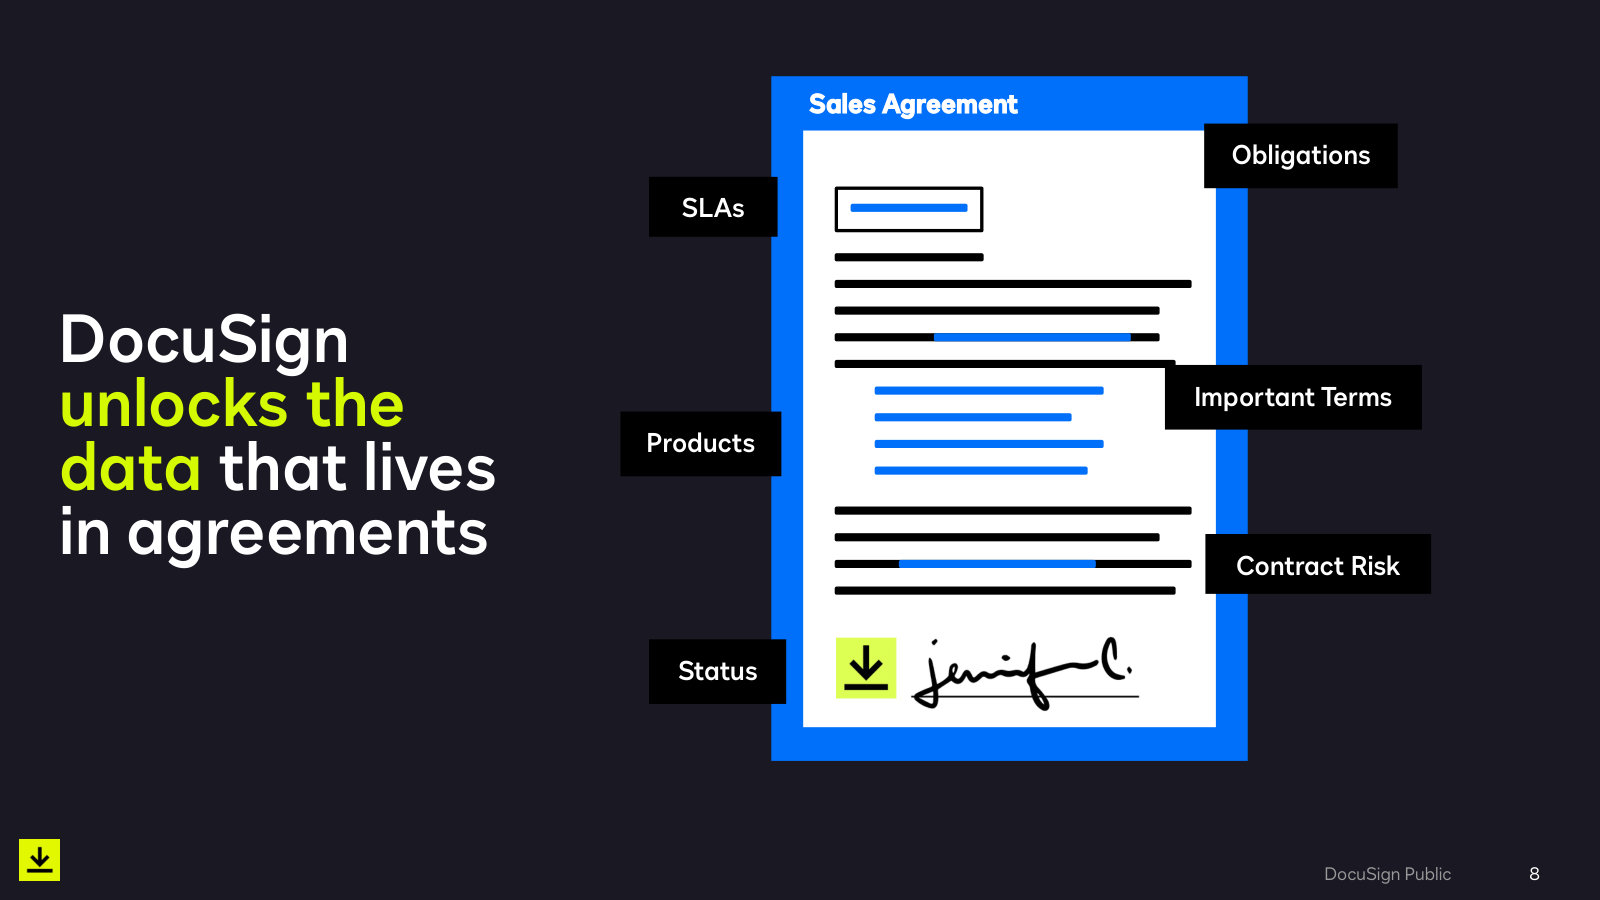
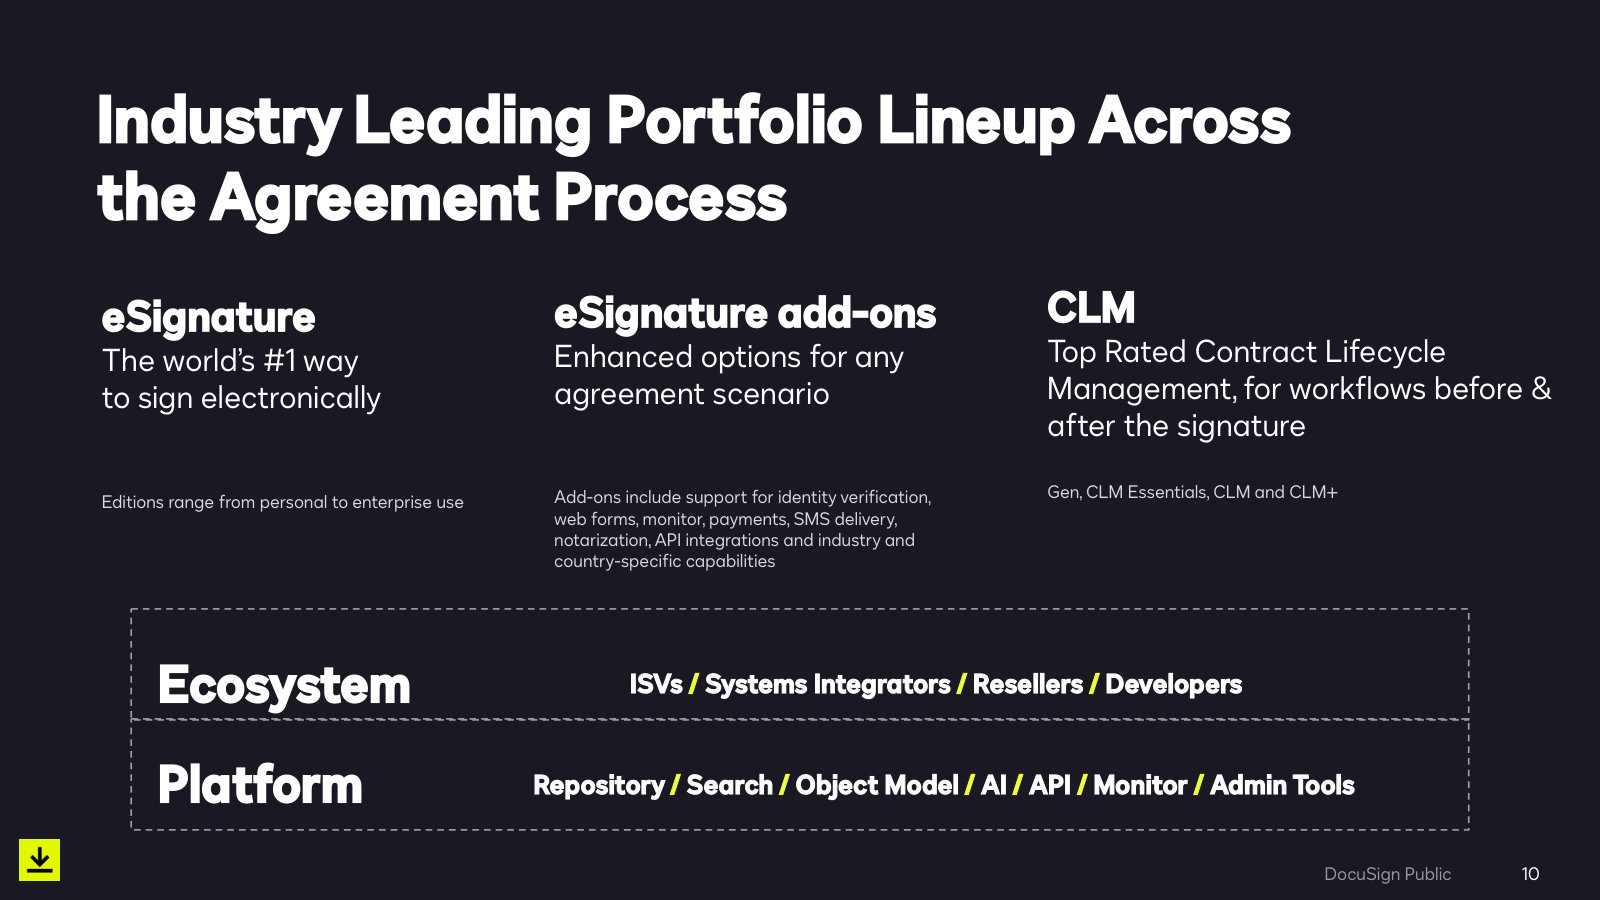
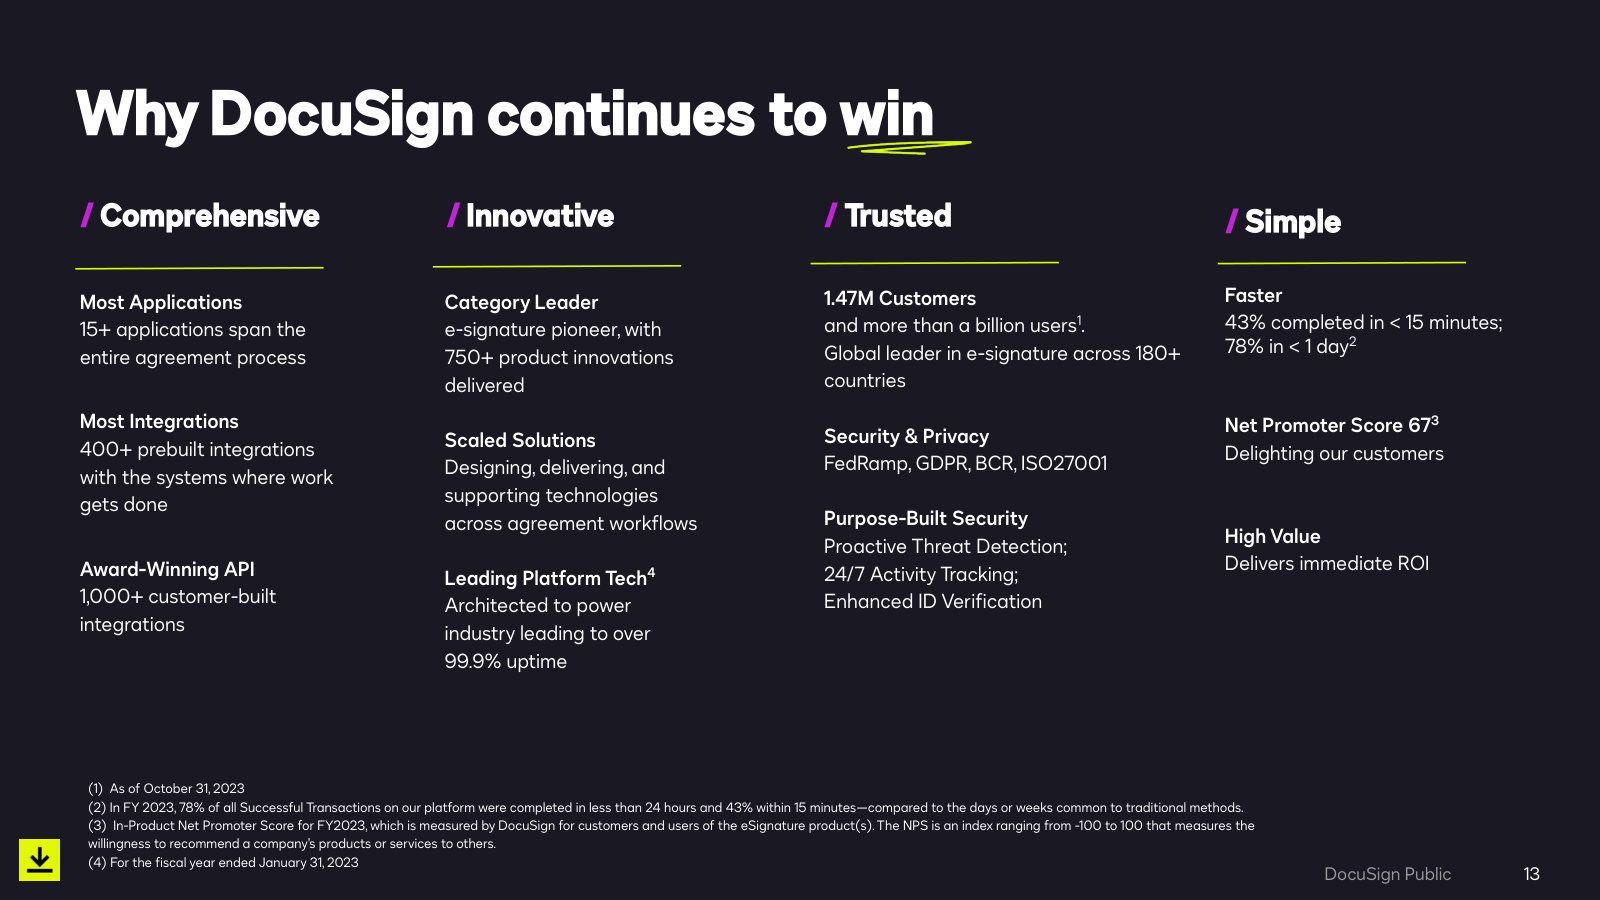
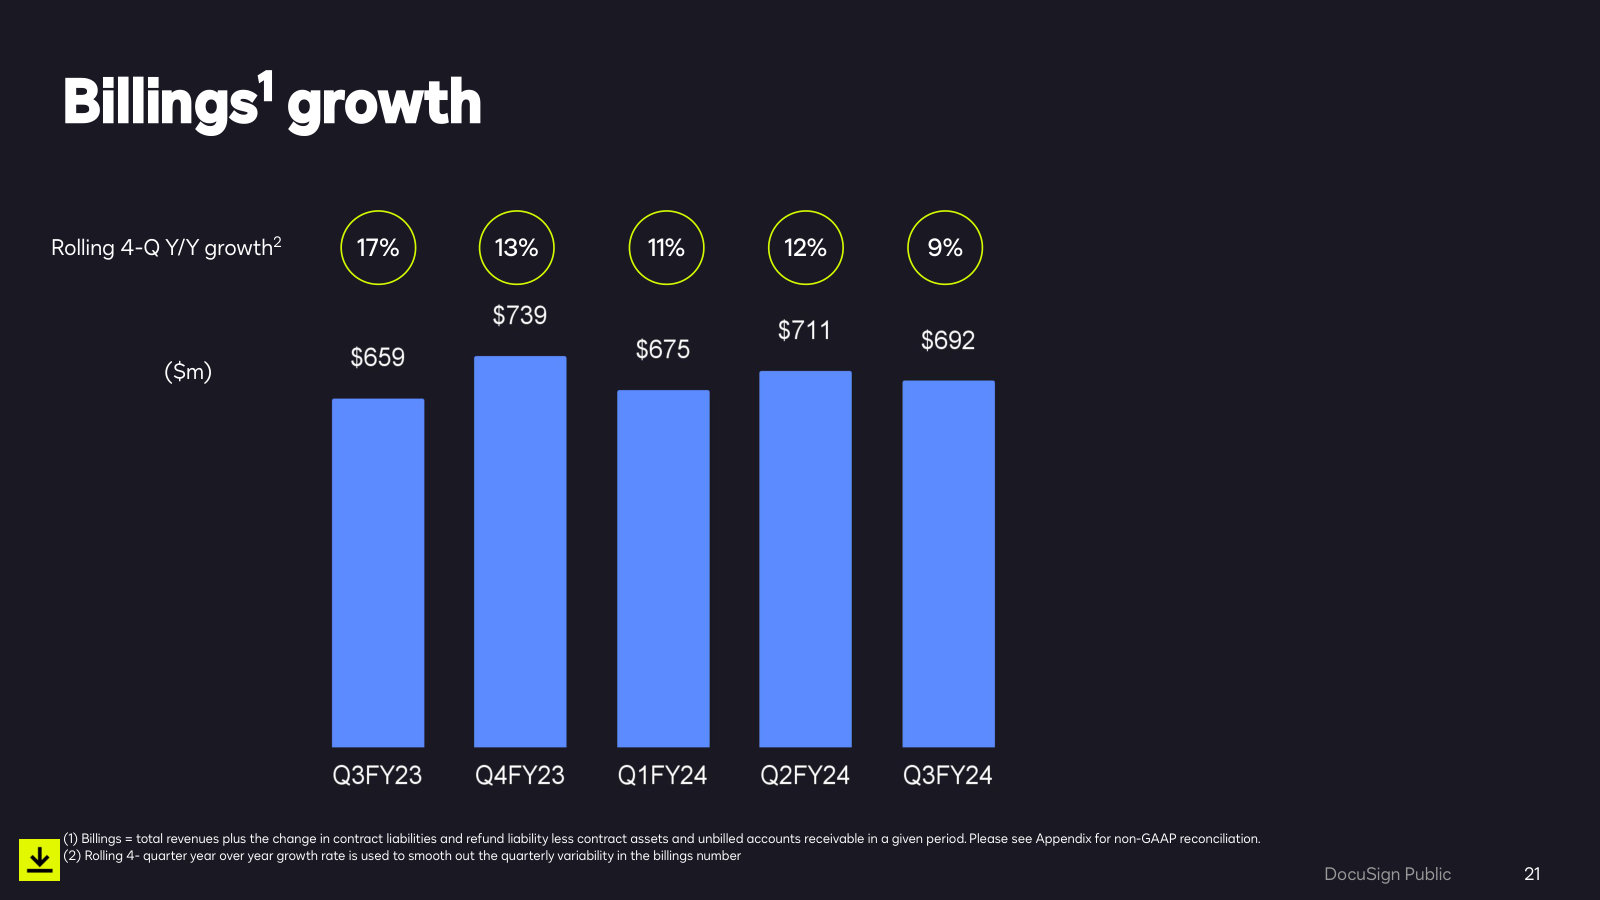
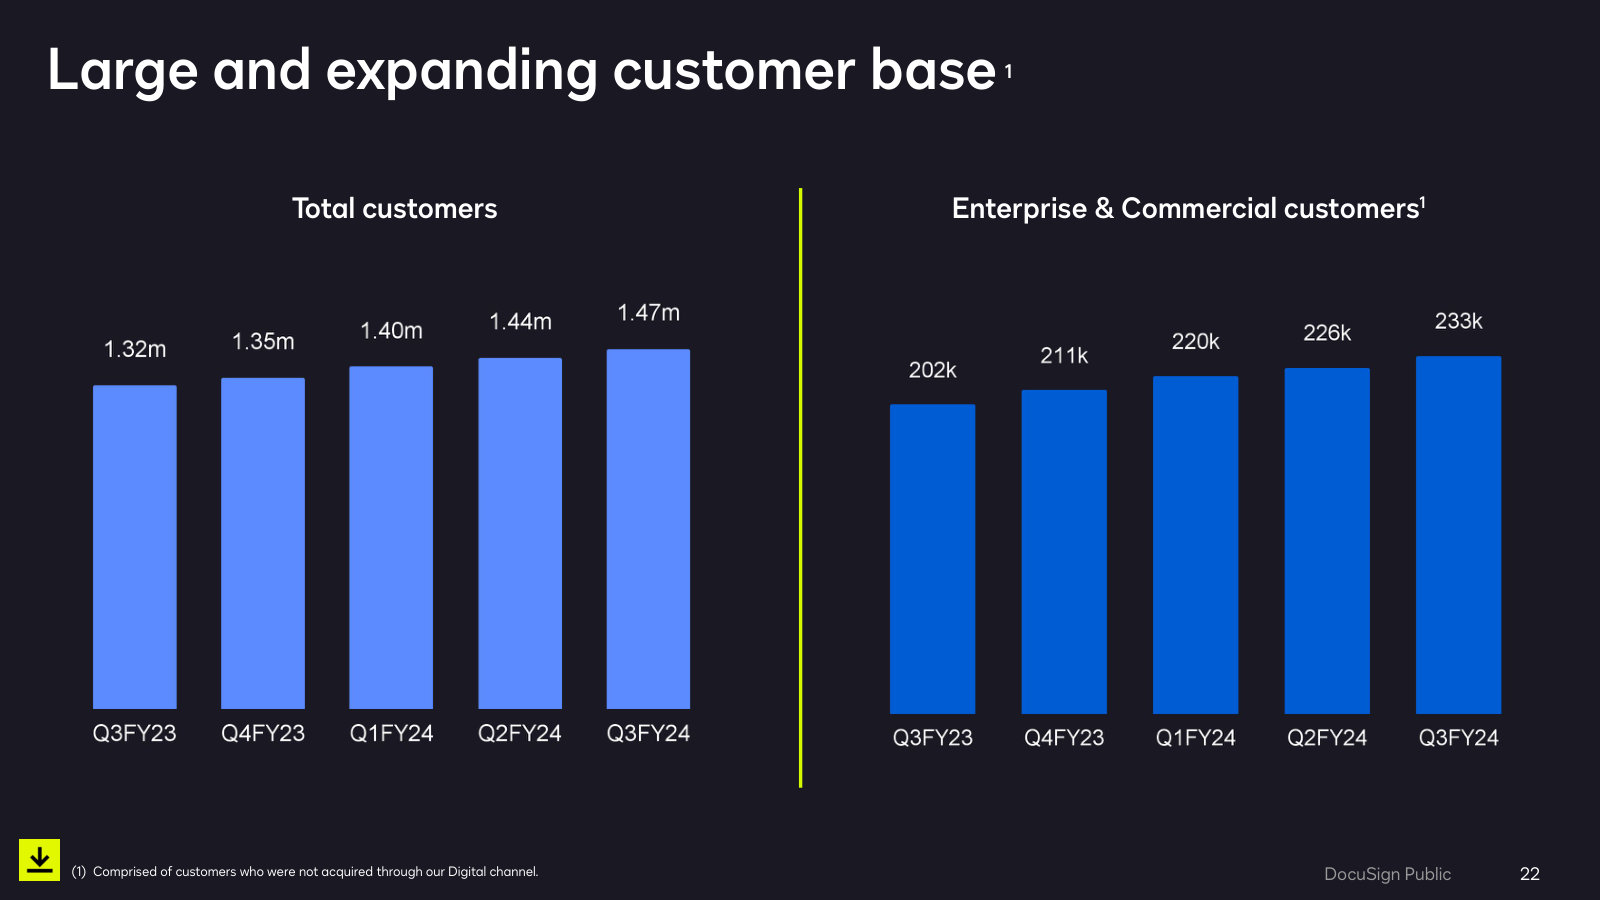
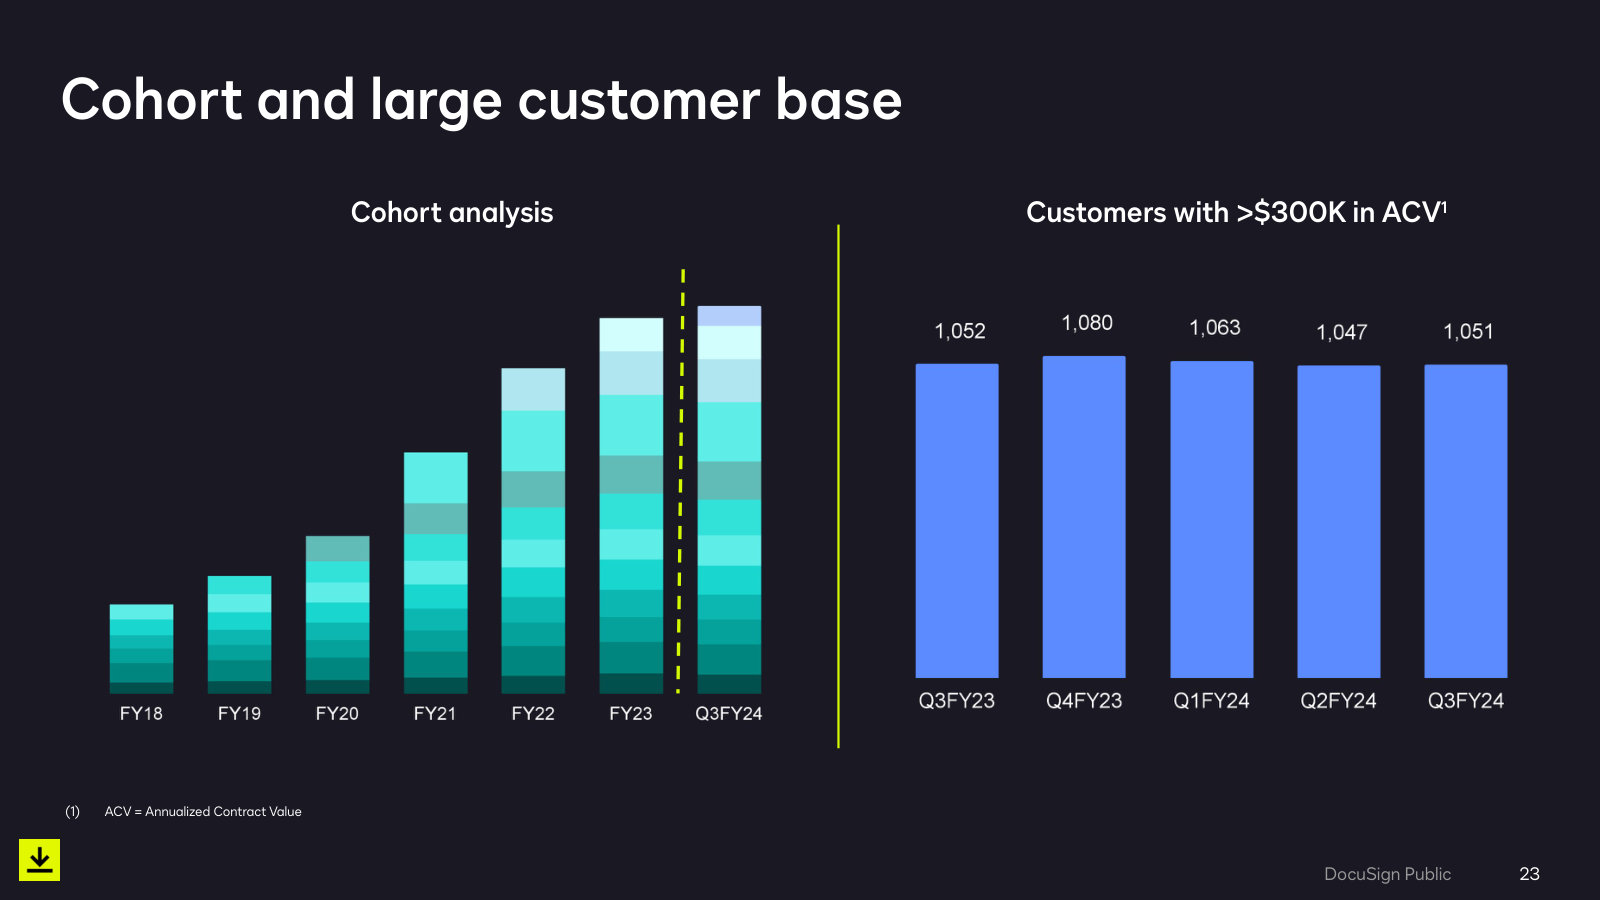
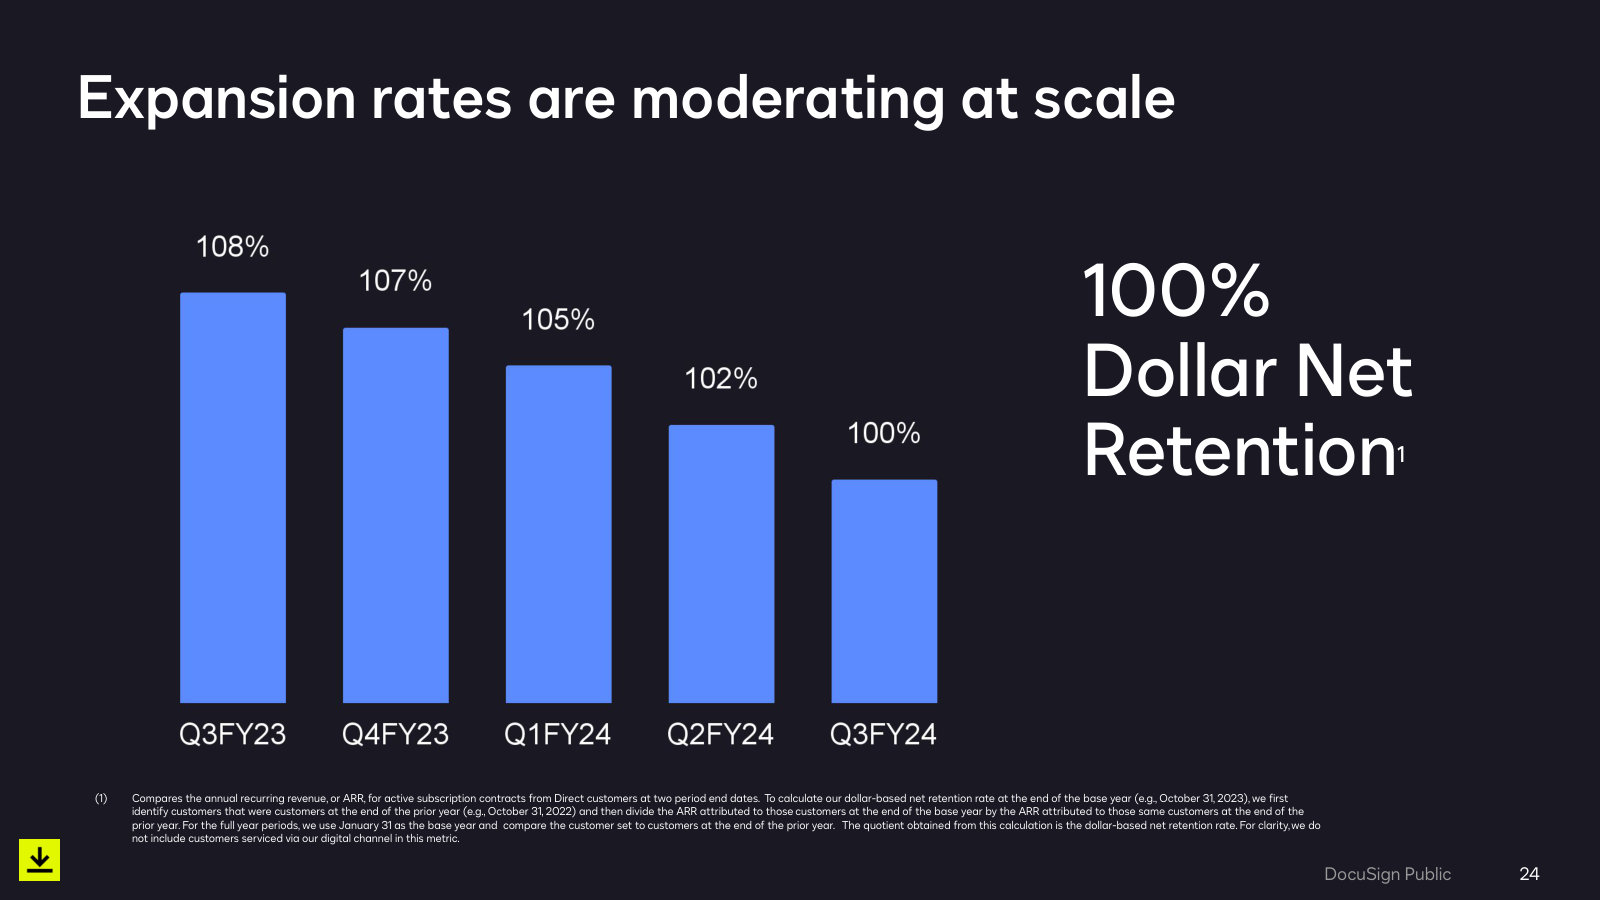
p. 4 — The starting point: 1.47M customers, $700M revenue growing 9%, 27% operating margin, dollar net retention already at 100%. · Open the full presentation →p. 6 — The original pitch — an 'agreement gap' between CRM, ERP and HCM systems where paper processes still live. · Open the full presentation →p. 7 — Going beyond the signature: generation, ID verification, negotiation, workflows, repository, analytics — the pivot before it had a name. · Open the full presentation →p. 8 — Why agreement data is the prize — obligations, terms and risk sit unread inside signed contracts. · Open the full presentation →p. 10 — The product line as it stood: e-signature, add-ons, and CLM. Compare with the IAM platform two years later. · Open the full presentation →p. 13 — The competitive case in management's own words — breadth, 400+ integrations, security certifications, NPS of 67. · Open the full presentation →p. 21 — Billings growth decelerating from 17% to 9% on a rolling four-quarter basis — the slowdown that set up the strategy change. · Open the full presentation →p. 22 — Customer counts still rising: 1.47M total, 233k enterprise and commercial. Growth in accounts, not in spend per account. · Open the full presentation →p. 23 — Cohort layers and the count of customers above $300k ACV — flat at roughly 1,050 for five quarters. · Open the full presentation →p. 24 — Dollar net retention falling 108% to 100% in five quarters. Management's own chart of the expansion problem. · Open the full presentation →
Investor Presentation — Q4 FY26 — Q4 FY26 · 36 pages · Full-year FY26 results, the first year-end ARR disclosure, and the FY27 guidance management is now being measured against. · Open →
Investor Presentation — Q3 FY26 — Q3 FY26 · 35 pages · The last deck to guide billings before the metric was retired, with IAM adoption still described as 25K+ customers. · Open →
Investor Presentation — Q4 FY25 — Q4 FY25 · 29 pages · FY25 results and the initial FY26 guidance — the reset year, one year into IAM and before ARR became the headline metric. · Open →
Investor Presentation — Q4 FY24 — Q4 FY24 · 33 pages · The last full-year deck before IAM launched — the e-signature-era baseline against which the pivot should be judged. · Open →